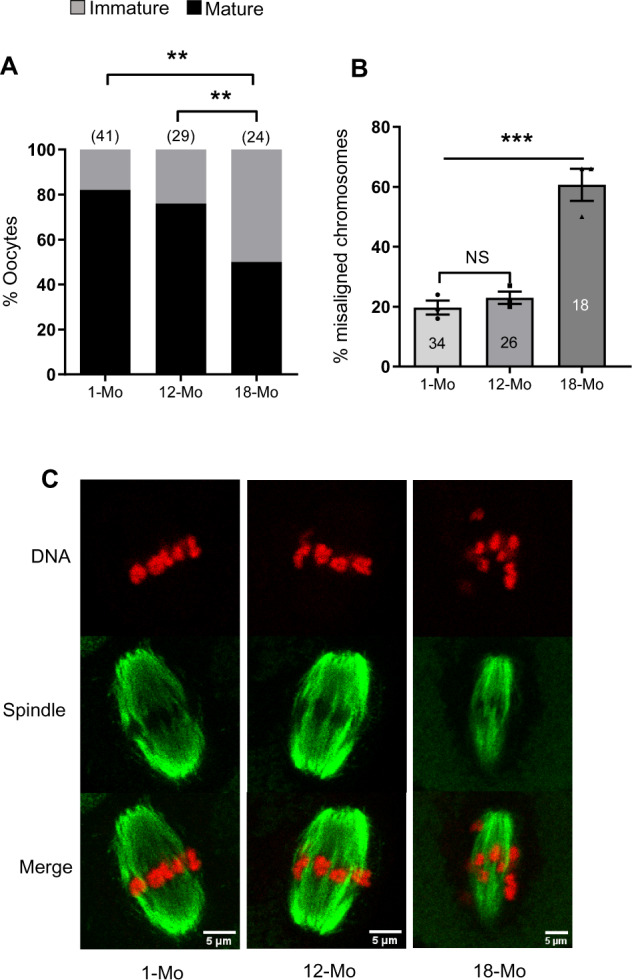
Figure 1.

Maturation and chromosomal misalignment rates of oocytes isolated from mice at different ages. (A) Maturation rates after in-vitro culture. (B) Percentage of oocytes with one or more misaligned chromosomes. (C) Representative images of MII oocytes with labeled spindles (green) and DNA (red). Mo, month. Results are presented from at least three replicate experiments in all cases. Error bars show SE of the mean. Number of oocytes analyzed in each group are shown. **P ≤ 0.01; ***P ≤ 0.001 and NS, not significant.
