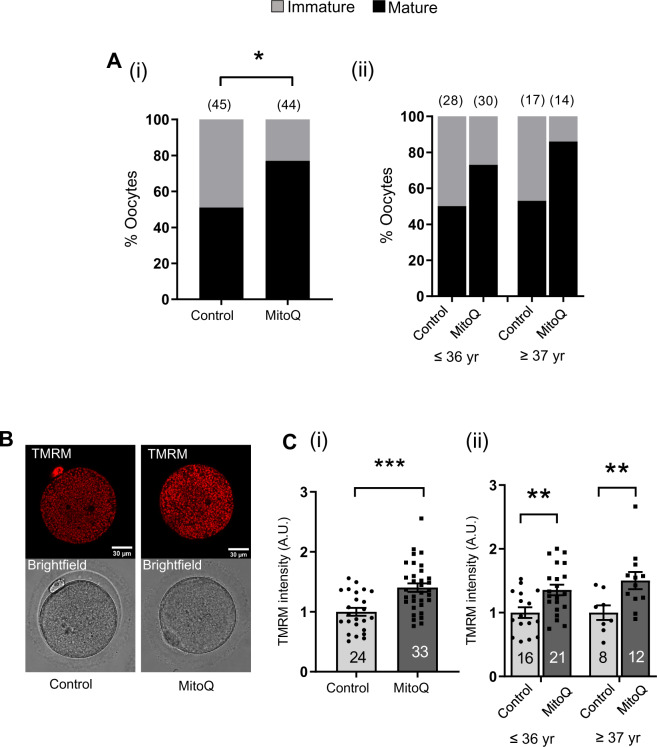
Figure 7.
IVM of human oocytes in the presence of MitoQ. (A) Comparison of maturation rates between control and 50 nM MitoQ-treated groups (i). Data are expressed as percentages and chi-square test was used to compare between groups, *P < 0.05. (ii) Comparison of maturation rates between control and MitoQ-treated oocytes from (i) in different age groups. (B) Representative Tetramethylrhodamine, Methyl Ester, Perchlorate (TMRM) fluorescence and bright field images. (C) Quantification of TMRM signal intensities between control and MitoQ-treated metaphase II (MII) oocytes (i). (ii) Comparison of TMRM signal intensities between control and MitoQ-treated oocytes from (i) in different age groups. Data are expressed as mean ± SEM. Chi-square test (A) or Student’s t-test (C) was used to compare between groups.; *P < 0.05, **P < 0.01 and ***P < 0.001.

