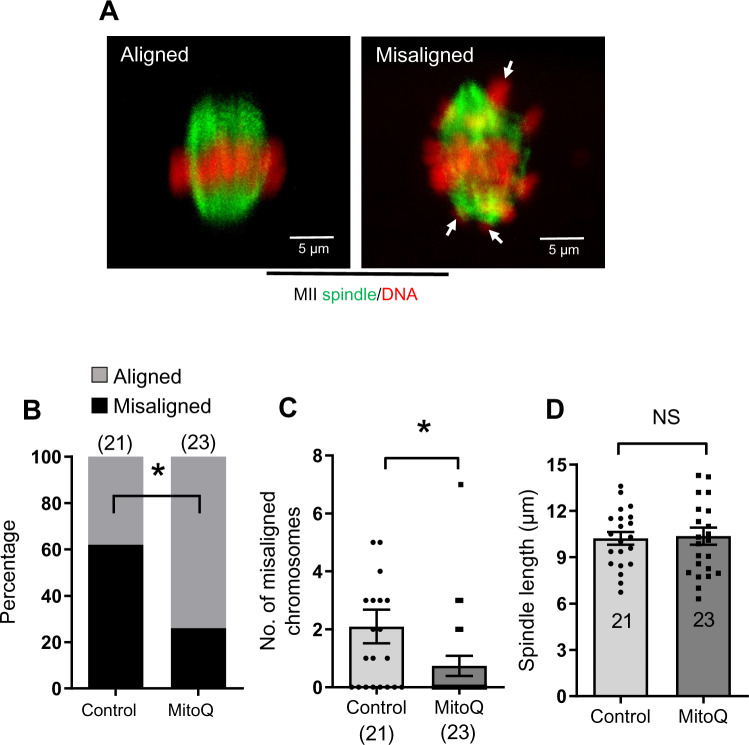
Figure 8.
Spindle and chromosome alignments in in-vitro matured human oocytes in the presence of MitoQ. (A) Examples of aligned and misaligned chromosomes (arrows). Metaphase II spindles and chromosomes were visualized by staining tubulin and DNA to analyze chromosomal misalignment. (B) Percentage of mature oocytes with aligned and misaligned chromosomes in control and MitoQ groups. (C) Number of misaligned chromosomes per oocyte in control and MitoQ groups. (D) Comparison of spindle length in control and MitoQ groups. Error bars show SE of the mean. Number of oocytes analyzed in each group are shown. Chi-square test (B) or Student’s t-test (C and D) was used to compare between groups. *P < 0.05, NS, not significant.

