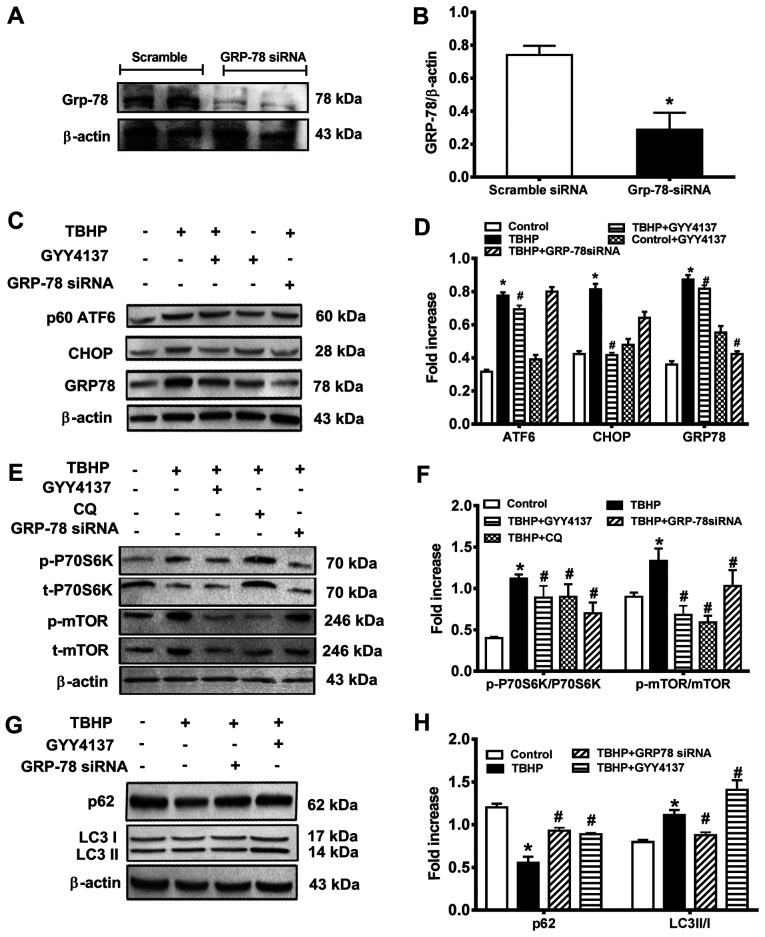
Figure 4.
GRP78 knockdown leads to autophagy inhibition and cell dysfunction. (A) Protein expression levels were measured by western blot analysis. The following groups were assessed: i) Scramble siRNA; and ii) Grp-78 siRNA. (B) Densitometric results are expressed as a fold increase. (C) Protein expression levels were measured by western blot analysis. The following groups were assessed: i) Control, normal DMEM; ii) TBHP; iii) TBHP + GYY4137, CHs pre-treated with 100 μM GYY4137; and iv) TBHP + GRP-78 siRNA, CHs transfected with 150 nM GRP-78 siRNA for 48 h. The upper trace of each group displays representative blots of the respective proteins. The trace of each group displays representative blots of the respective proteins. (D) Densitometric results are expressed as a fold increase. (E) Protein expression levels were measured by western blot analysis. The following groups were assessed: i) Control, normal DMEM; ii) TBHP; iii) TBHP + GYY4137, CHs were pre-treated with 100 μM GYY4137; iv) TBHP + GRP-78 siRNA, CHs were transfected with 150 nM GRP-78 siRNA for 48 h; and v) TBHP + CQ, CHs were treated with autophagic inhibitor CQ. The upper trace of each group displays representative blots of the respective proteins. (F) Densitometric results are expressed as a fold increase. (G) Protein expression levels were measured via western blotting. The following groups were assessed: i) Control, normal DMEM; ii) TBHP; iii) TBHP + GYY4137, CHs were pre-treated with 100 μM GYY4137; and iv) TBHP + GRP-78 siRNA, CHs were transfected with 150 nM GRP-78 siRNA for 48 h. (H) Densitometric results are expressed as a fold increase. *P<0.05 vs. control; #P<0.05 vs. TBHP. TBHP, tert-Butyl hydroperoxide; CH, chondrocyte; GRP78, 78-kDa glucose-regulated protein; siRNA, small interfering RNA; CQ, chloroquine.

