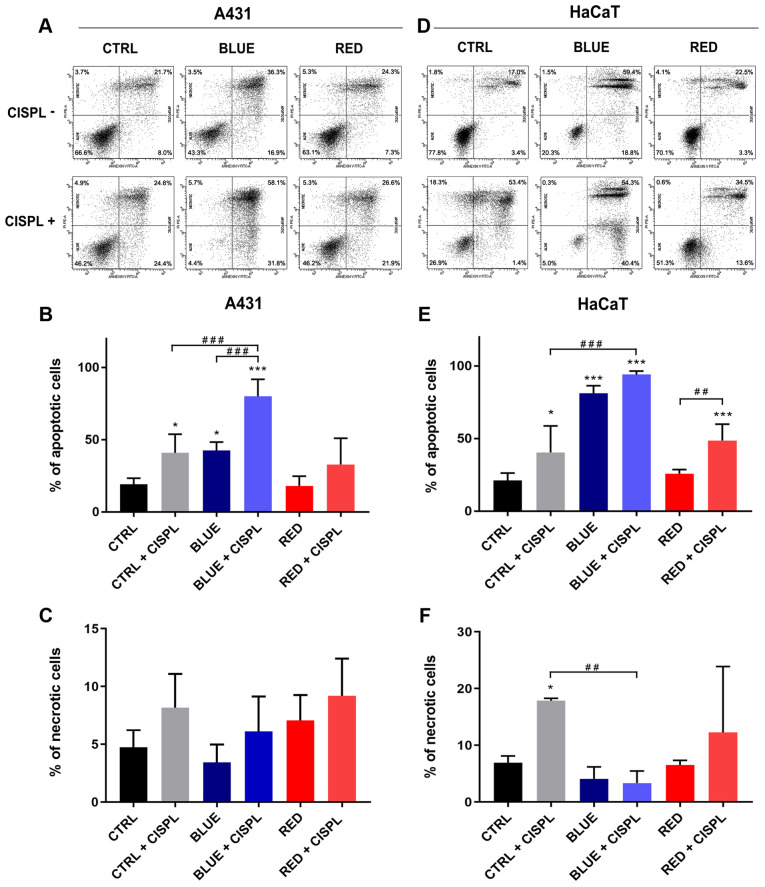
Figure 3.
Apoptotic and necrotic effects of exposure of A431 and HaCaT cells to LED, cisplatinum, and LED and cisplatinum combined. Data indicate the percentage of apoptotic (Annexin V+) and necrotic (Annexin V-/PI+) cells of the (A-C) A431 and (D-F) HaCaT cell lines. Columns represent mean values and bars represent ± SD (n=3). *P<0.05, and ***P<0.001 vs. CTRL. ##P<0.01 and ###P<0.001. LED, light-emitting diode; SD, standard deviation.

