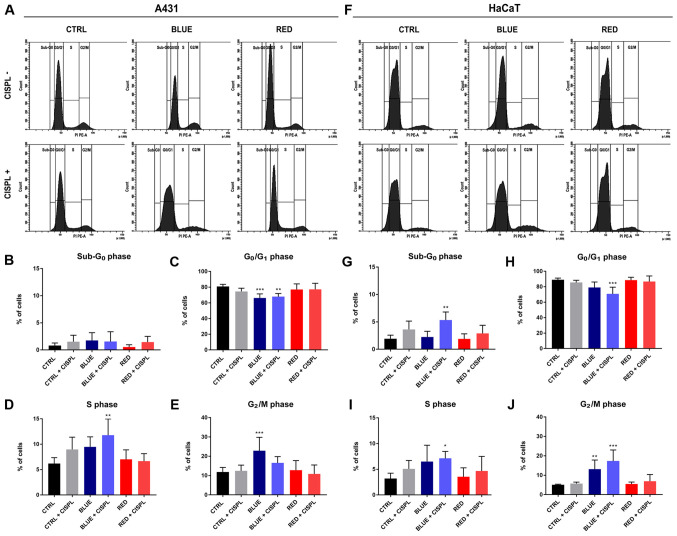
Figure 4.
Effect of exposure to LED, cisplatinum, and LED and cisplatinum combined on cell cycle progression in A431 and HaCaT cells. Data indicate the effect of every treatment on the different cell cycle phases of the (A-E) A431 and (F-J) HaCaT cell lines. Columns represent mean values and bars represent ± SD (n=3). *P<0.01, **P<0.001 and ***P<0.05 vs. CTRL. SD, standard deviation.

