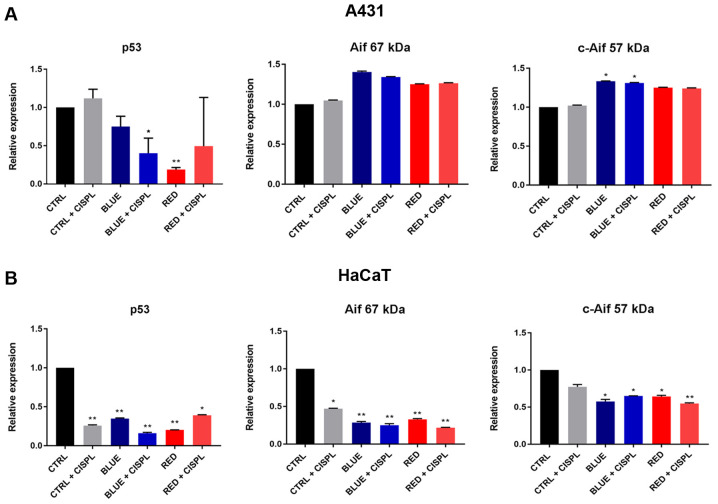
Figure 7.
Western blot analysis of apoptosis-related proteins Aif and p53 in (A) A431 and (B) HaCaT cells. Values were normalized to GAPDH. Columns represent mean values and bars ± SD (n=3). *P<0.05 and **P<0.01 vs. CTRL. Representative blot bands are presented in Fig. S1. Aif, anti-apoptosis independent; SD, standard deviation.

