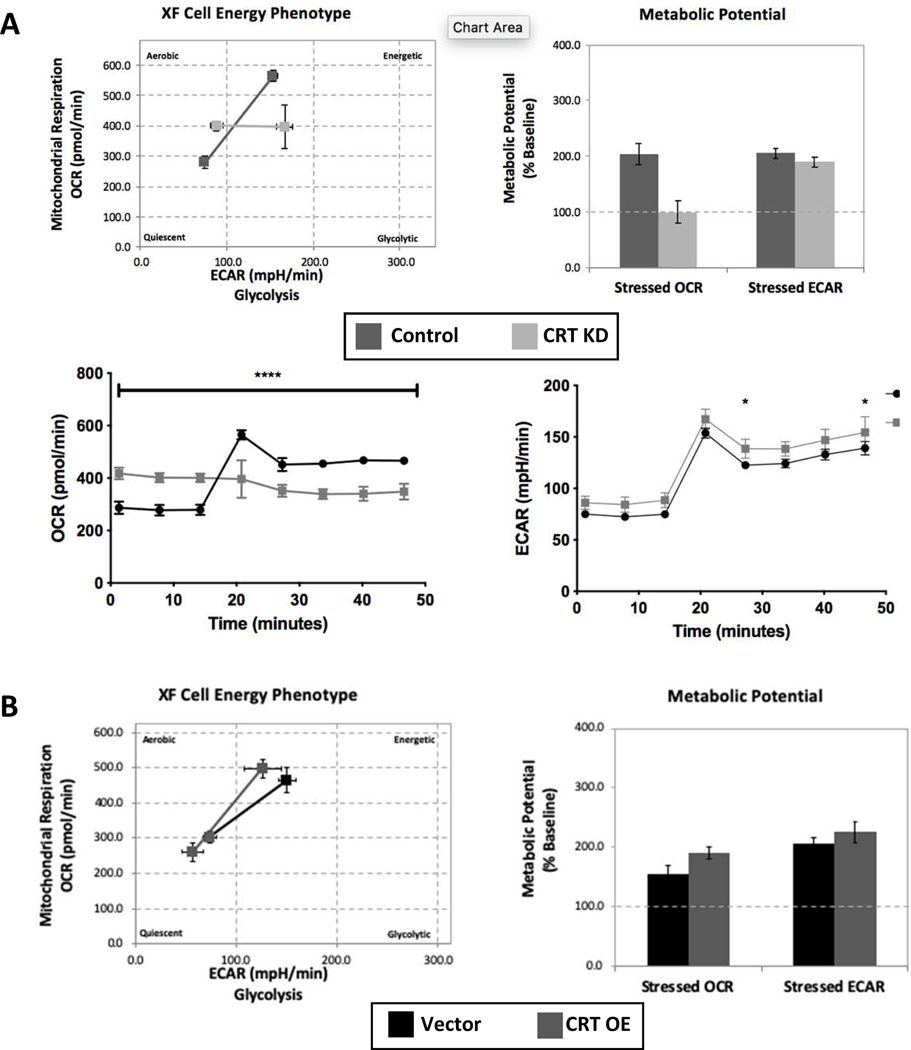
Figure 5. Influence of CRT knockdown on IEC metabolic phenotype.
A. Control and CRT KD cells were grown on Seahorse analysis plates. Cells were then evaluated using the metabolic phenotype profiling protocol that measures metabolic activity with the addition of stressors FCCP and oligomycin. Measurements of OCR and ECAR were compared under baseline and stressed conditions. Metabolic potential was calculated based on ability to increase OCR and ECAR over baseline values. OCR and ECAR values plotted vs time with addition of stressors after third time point. B. The same metabolic analysis was conducted comparing the Vector and CRT OE cells. *P<0.05, ****p<0.0001 determined by two-way ANOVA.

