
Fig. 4.
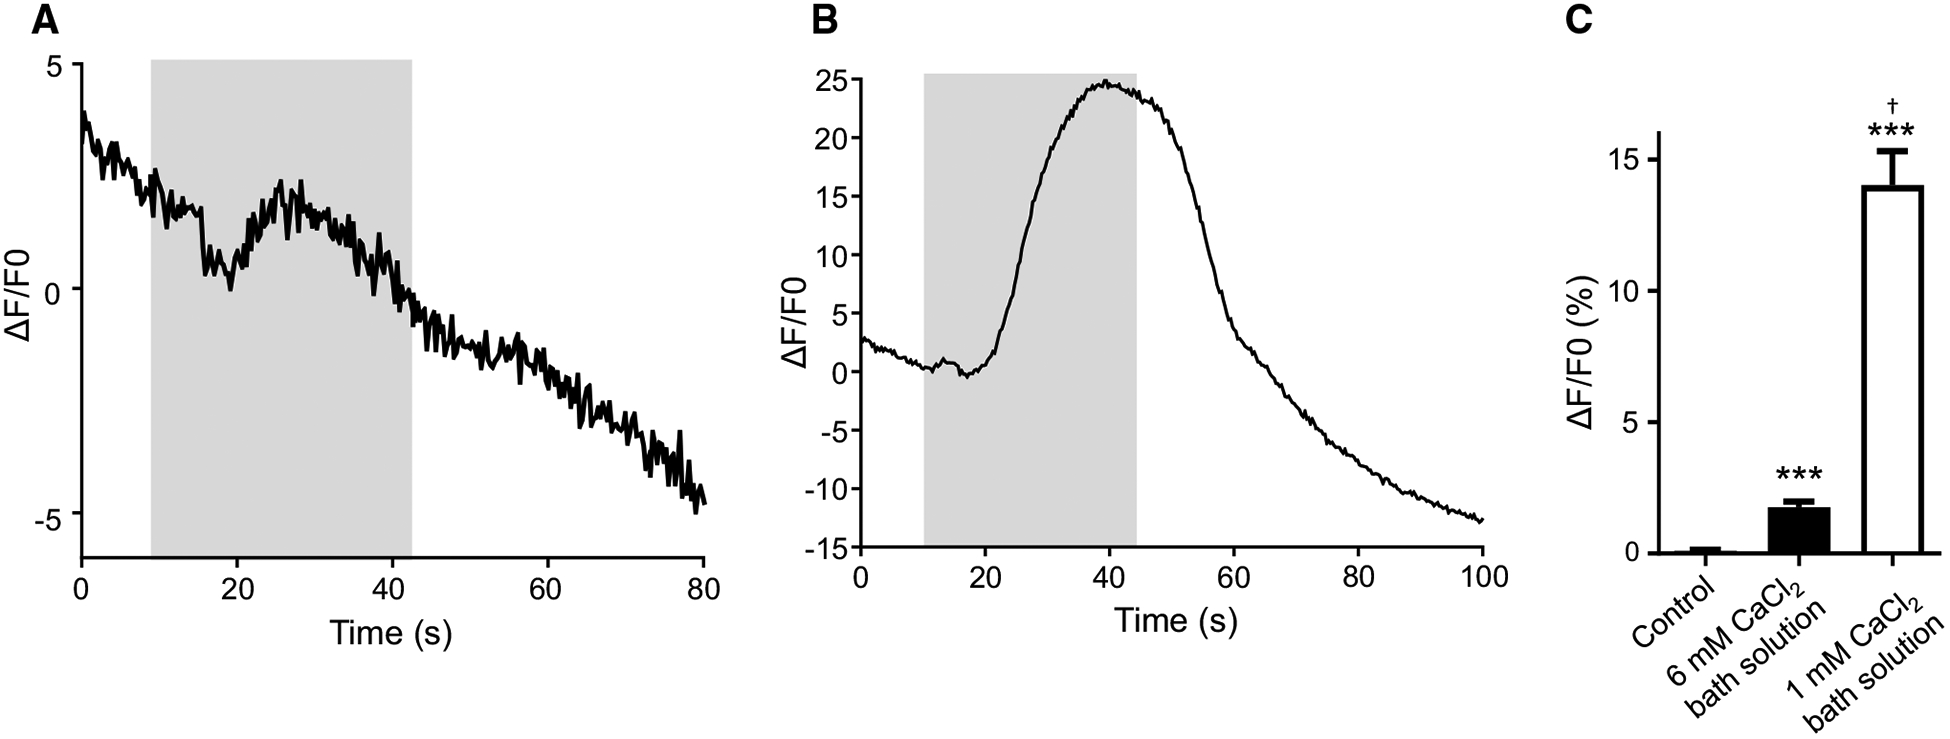
Fluo-3AM treated muscles cells display Ca2+ signals: a representative calcium trace of a muscle exposed to 10 mM CaCl2 that was maintained in regular bath solution before stimulus application. Gray box represents stimulus application. b Representative calcium trace in response to 10 mM CaCl2 in a muscle maintained in low CaCl2 (1 mM) bath solution. Gray box represents stimulus application. c Amplitudes of calcium signals in muscles perfused with low calcium bath solution, 10 mM CaCl2 in regular bath solution and 10 mM CaCl2 in low CaCl2 bath solution. ***Significantly different from untreated (untreated vs. 10 mM CaCl2 regular buffer; P < 0.0001, t = 6.792, df = 25, unpaired t test), (untreated vs. 10 mM CaCl2 low CaCl2 buffer; P < 0.0001, t = 8.273, df = 30, unpaired t test). † = significantly different to 10 mM CaCl2 in regular buffer (10 mM CaCl2 in regular buffer vs. 10 mM CaCl2 in low CaCl2 buffer P = < 0.0001, t = 8.108, df = 33, unpaired t test). Untreated n = 12; 10 mM CaCl2 in regular buffer n = 15, 10 mM CaCl2 in low CaCl2 buffer n = 20. All values are represented as mean ± SEM