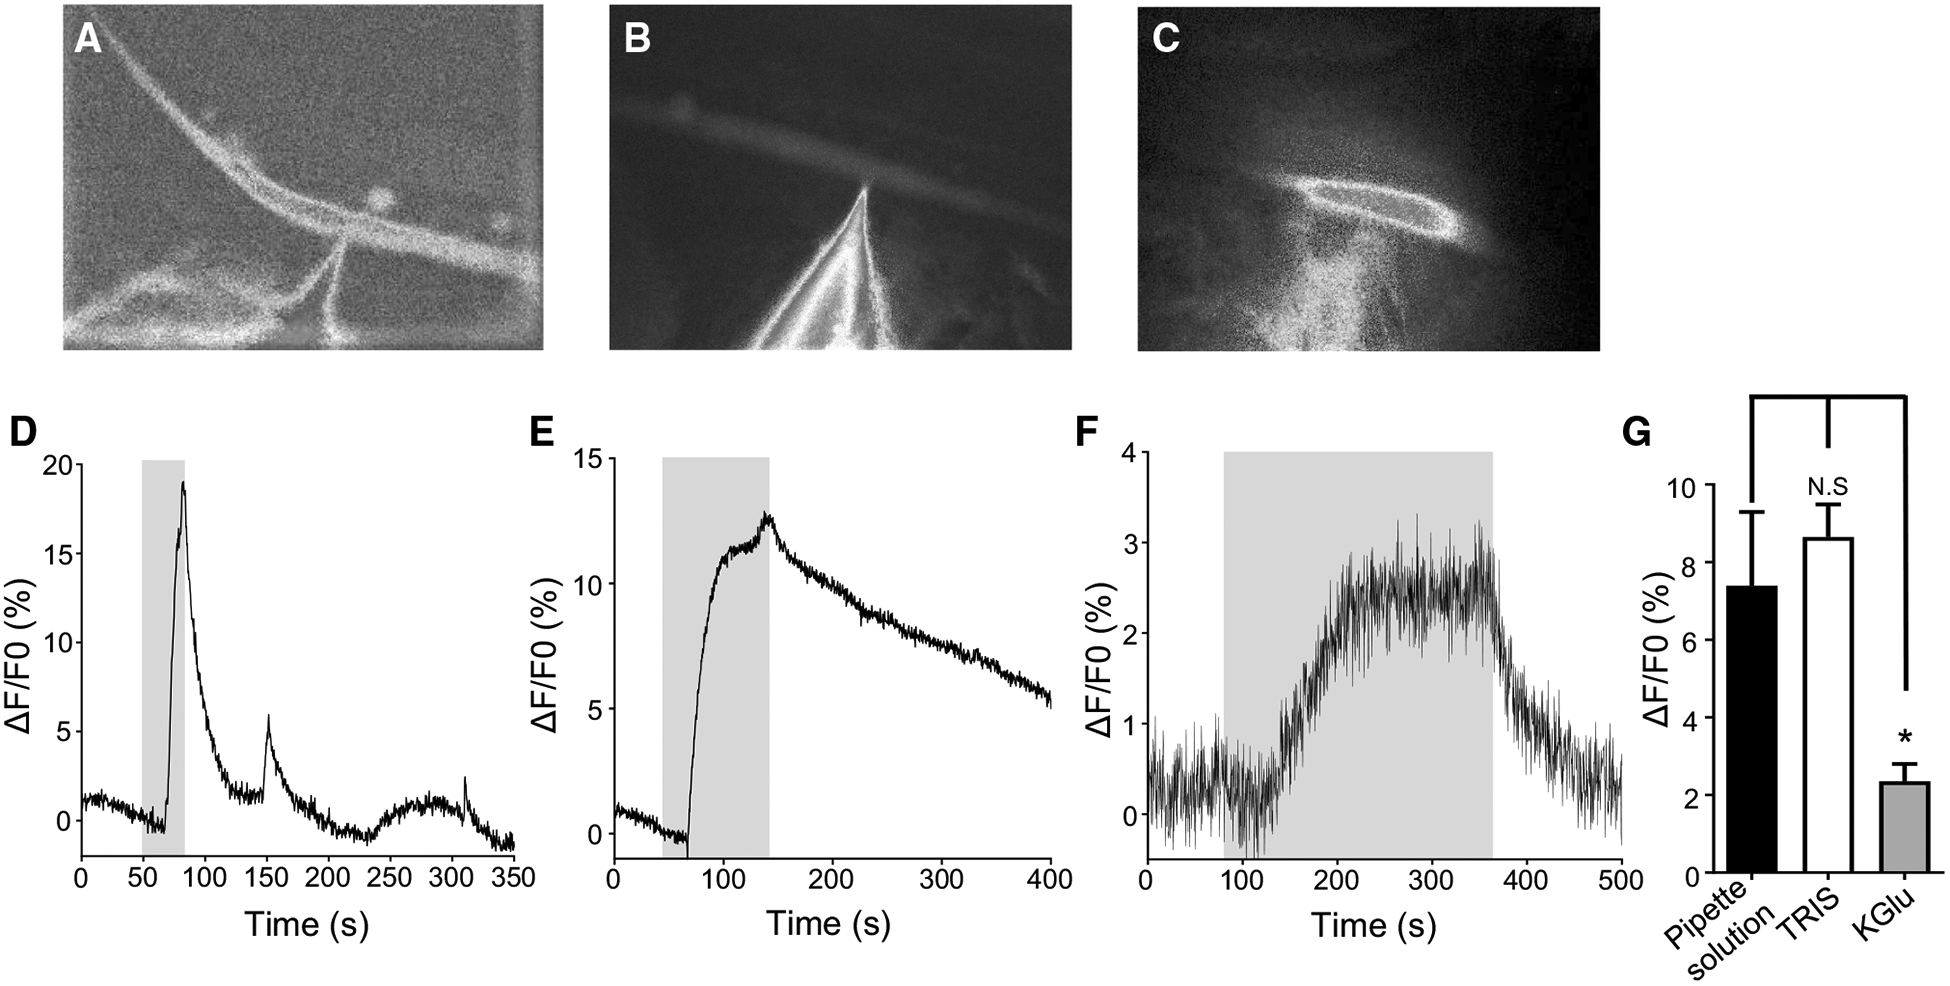
Fig. 5.

Microinjection of Fluo-3: a micrograph of muscle under blue light injected with electrophysiology pipette solution containing 5 μM Fluo-3. b Micrograph of Fluo-3 injection using TRIS-HCl. c Micrograph of Fluo-3 injection using K-gluconate solution. d Representative trace of a calcium response to 10 mM CaCl2 in a muscle injected with pipette solution containing Fluo-3. Gray box indicates stimulus application. e Representative trace of TRIS-HCl Fluo-3 inject muscles to 10 mM CaCl2. Gray box indicates stimulus application. f Representative trace of calcium signal in muscle inject with Fluo-3 using K-gluconate solution. Gray box indicates stimulus application. g Quantification of calcium amplitudes to 10 mM CaCl2 in muscles injected using pipette solution (black bar), TRIS-HCl (white bar) and K-gluconate (gray bar). N.S. = not significant pipette solution versus TRIS-HCl (P = 0.5526, t = 0.6031, df = 22, unpaired t test). *Significantly different pipette solutions versus K-Glu (P = 0.0220, t = 2.473, df = 21, unpaired t test). Pipette solution n = 12; TRIS-HCl n = 12, K-Glu n = 11. All values are represented as mean ± SEM
