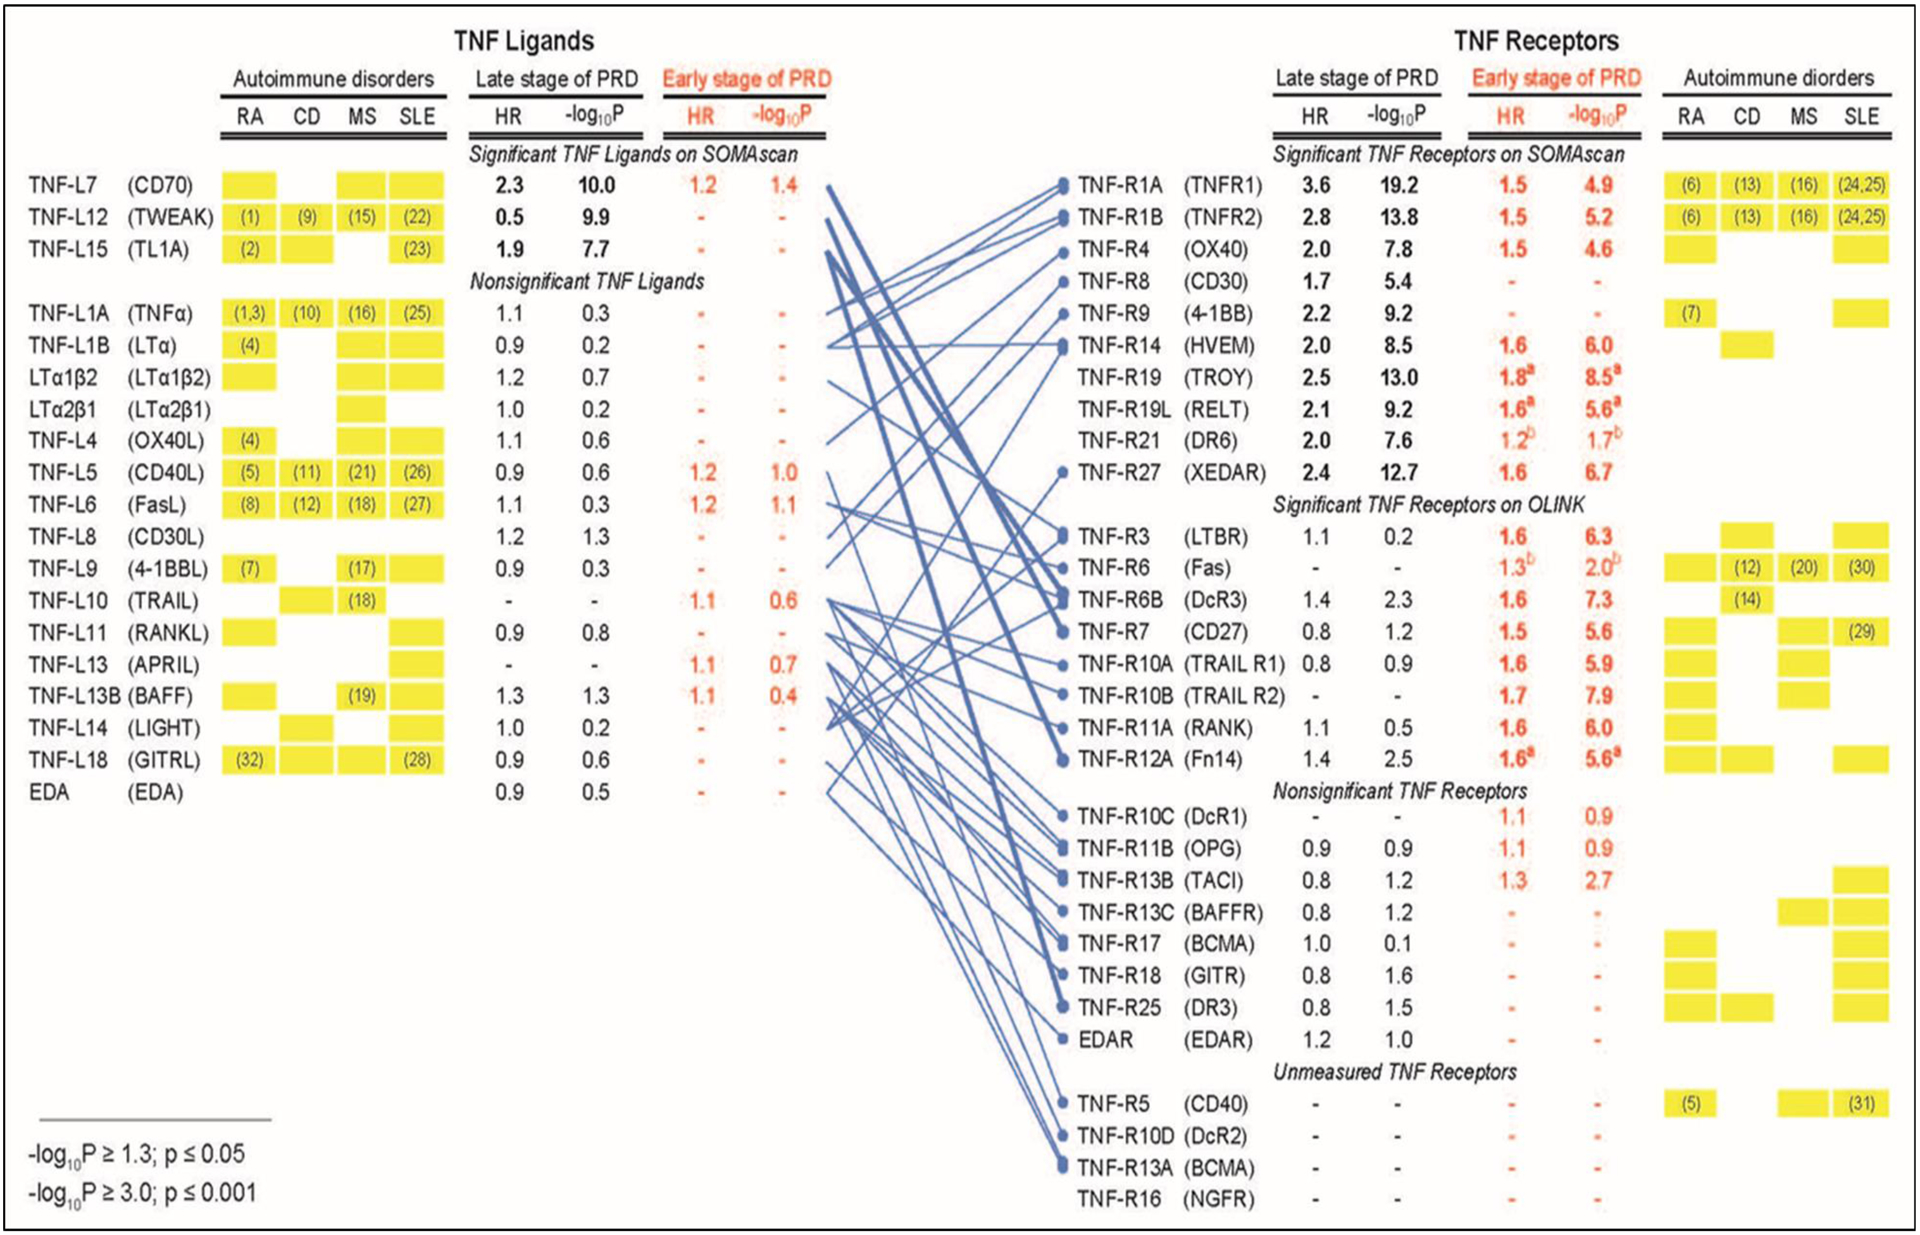
Figure 6.

Profiles of tumor necrosis factor (TNF) proteins associated with late and early stages of progressive renal decline (PRD) in type 1 diabetes (T1D) compared with profiles of TNF proteins associated with autoimmune disorders. The binding patterns of TNF ligands to TNF receptors are as reported in our previous publication (8). Cox proportional hazards model was used to estimate effect (hazard ratio, HR) of TNF proteins on time-to-onset of ESKD in two T1D studies: 1) previous study (n= 219) that focused on late PRD (8) and 2) present Macro-Albuminuria Study (n= 198) that focused on early PRD. Baseline plasma concentration of TNF proteins in the previous study were determined by SOMAscan and by OLINK in the present study. HRs were estimated as one quartile change in TNF superfamily proteins. Univariate HRs are represented.
Bonferroni adjusted statistical significance is considered if –log10 p-value ≥3.00 (equivalent of p ≤0.001) on either platform (adjustment was made for 19 TNF ligands and 30 receptors). The results from the previous study and the present study are represented in black and red, respectively. The HRs and p values for TNF ligands and receptors whose effects were statistically significant are shown as bold letters. Subscript a) indicates 3 TNF receptors that were statistically significant in Macro- but not in Micro-Albuminuria Study, and subscript b) indicates 2 TNF receptors that were not significant in Macro-Albuminuria Study but were significant when Macro- and Micro-Albuminuria were analyzed together.
Yellow boxes indicate profiles of TNF proteins observed in autoimmune disorders: RA (Rheumatoid Arthritis), CD (Crohn’s Disease), MS (Multiple Sclerosis), and SLE (Systemic Lupus Erythematosus). These profiles were obtained from review articles (3–7) and the Database for Annotation, Visualization and Integrated Discovery (David) Bioinformatics Resources 6.8 (https://david.ncifcrf.gov/). Associations supported by studies with measurements of plasma and/or serum concentrations of the TNF superfamily proteins are denoted by reference numbers in yellow boxes (For references see Supplementary References).
