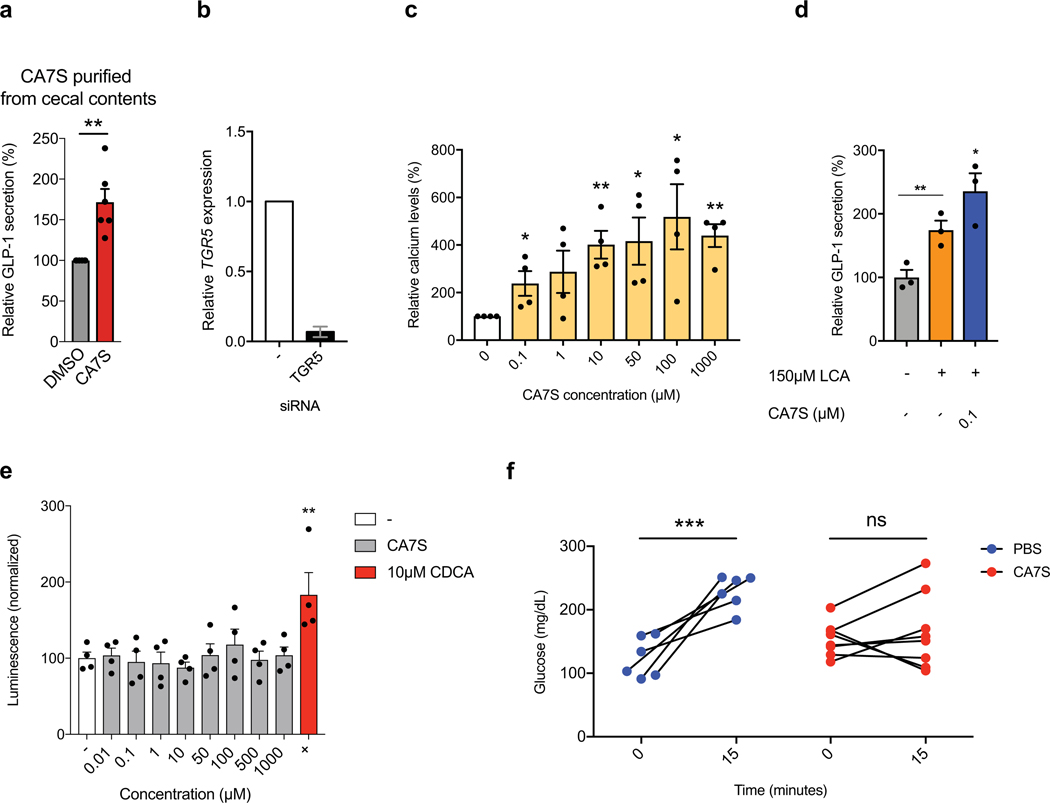
Extended Data Fig. 5. CA7S agonizes TGR5 but not FXR, induces GLP-1 secretion, and reduces systemic glucose levels.
a, CA7S (500 μM) purified from SG mouse cecal contents induced secretion of GLP-1 in NCI-H716 cells compared to DMSO control (6 biological replicates per condition, **p=1.00×10⁻³, two-tailed Welch’s t-test). b, Quantitative real time PCR analysis of expression of human TGR5 in TGR5 siRNA and negative (−) siRNA-treated NCI-H716 cells for Fig. 3b. c, CA7S induced an increase in intracellular calcium levels in NCI-H716 cells (4 biological replicates per condition, CA7S 10 μM *p=0.03, 50 μM *p=0.02, 100 μM **p=1.80×10⁻³, 100 μM *p=0.01, one-way ANOVA followed by Dunnett’s multiple comparisons test). d, CA7S induced secretion of GLP-1 in the presence of a physiologically relevant concentration of LCA (150 μM) (3 biological replicates per condition, DMSO (−) control vs. LCA **p=9.90×10⁻³, CA7S vs. LCA 0.1 μM *p=0.03, two-way ANOVA followed by Dunnett’s multiple comparisons test). e, CA7S did not induce activation of endogenous FXR in Caco-2 cells compared to (−) DMSO control. Known FXR agonist CDCA (10 μM) was used as a positive control (4 biological replicates per condition, CA7S 0.01–50 μM and 500–1000 μM not significant p=0.99, CA7S 100 μM not significant p=0.96, CDCA 10 μM **p=4.60×10⁻³, one-way ANOVA followed by Dunnett’s multiple comparisons test). f, In vivo change in serum glucose upon acute enteral treatment with PBS and CA7S (PBS, n=6; CA7S, n=8 mice, ***p=1.00×10⁻⁴, ns=not significant p=0.63, two-tailed paired t-test). All data are presented as mean ± SEM.

