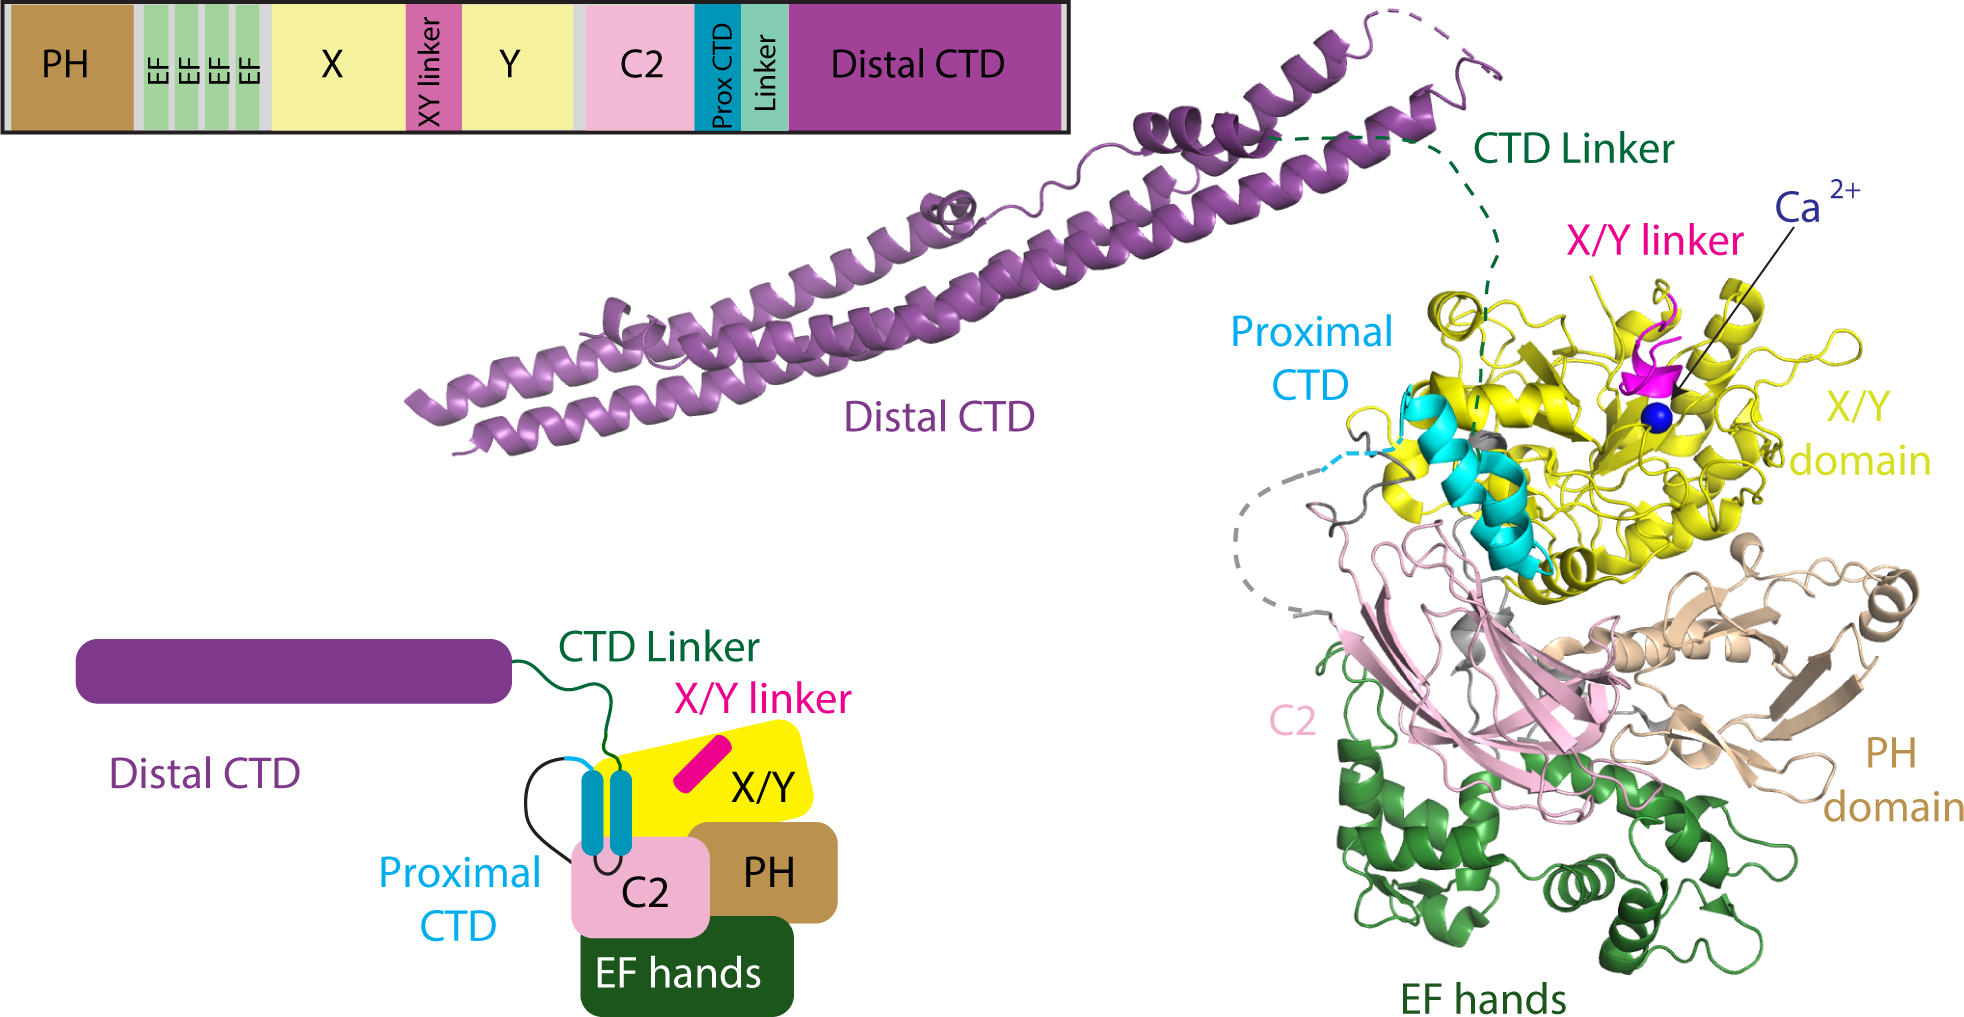
Figure 1: Domain Architecture and model of PLCβ2 architecture.

A model of PLCβ2 based on a monomer of PLCβ3 from the co-crystal structure of Gαq-PLCβ3 (PDB:4GNK), and the resolved portion of the proximal CTD from the structure of S. officinalis PLC21 (PDB: 3QR0). This model is oriented such that the active site (as indicated by the catalytic Ca2+ ion) is oriented towards the top of the figure. Domains are colored as in the domain schematics in the top and bottom left and the domain boundaries are (PLCβ2 numbering system) PH domain: 15–135; EF hands: 143–296; X: 321–466; XY Linker: 466–537; Y: 537–662; C2: 672–803; Prox CTD: 809–837; CTD Linker: 838–874; Distal CTD: 875–1150. The Gαq binding Helix-loop-Helix (amino acids: 810–827) is disordered in the structures solved in the apo PLCβ models with no bound Gαq. A model of the structure is shown on the right, with this used as a template for describing all HDX-MS data.
