. 2021 Feb 8;10:e58838. doi: 10.7554/eLife.58838

Figure 4. Innate lymphoid cell precursor (ILCP)-mediated upregulation of adhesion molecules on ECs involves the engagement of TNFR1, TNFR2, and RANK.

ILCPs were incubated overnight in the presence of 10 U/mL of rhIL-2 and an additional pre-incubation of 30 min (prior co-culture with ECs) was performed in the presence of 5 μg/mL of RANK:Fc (a), of 2 μg/mL of TNFR1:Fc, 5 μg/mL of TNFR2:Fc, and 5 μg/mL of RANK:Fc, either alone or in combination (b and c). ECs were harvested and analyzed for cell-surface adhesion molecule expression by flow cytometry (n = 3). The dotted lines indicate the level of average expression of adhesion molecules by unstimulated ECs. Statistical test used: Paired t-test.

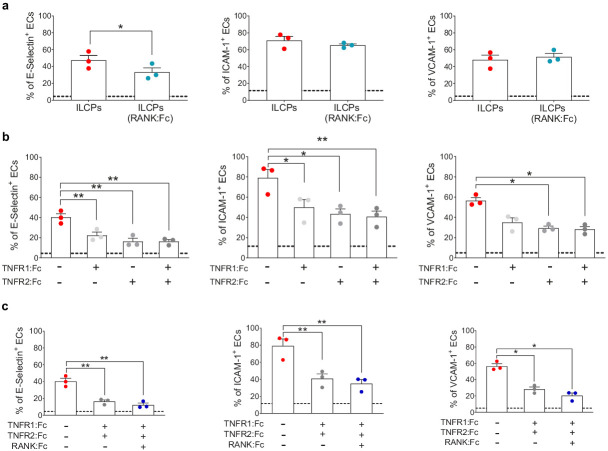
Figure 4—source data 1. Raw data of panels a–c.

Figure 4.

Figure 4—figure supplement 1. Innate lymphoid cell precursor (ILCP)-mediated modulation of RANK expression on endothelial cell (EC) surface.

Figure 4—figure supplement 1.

(a) HUVEC cells were co-cultured for 3 hr at 1:1 ratio in direct contact with in vitro-expanded ILCPs. Untreated ECs were employed as negative control (CTRL). ECs were harvested and analyzed for cell-surface RANK expression by flow cytometry. Graphs show a representative histogram (left) and the summary (right) of the induction of RANK expression on the EC surface by ILCPs isolated from three different donors. (b) ILCPs were incubated for an overnight in the presence of 10 U/mL of rhIL-2 and an additional pre-incubation of 30 min (prior co-culture with ECs) was performed in the presence of 2 μg/mL of IVIGs, or left untreated. ECs were harvested and analyzed for cell-surface adhesion molecule expression by flow cytometry (n = 3). The dotted lines indicate the level of average expression of adhesion molecules by unstimulated ECs. (c–e) The supernatant of the 3 hr co-culture experiments between ECs and ILCPs pre-incubated with Fc fusion proteins were analyzed for cytokine content (n = 3). The dotted lines indicate the average level of cytokines produced by unstimulated ECs. Paired t-tests.
Figure 4—figure supplement 1—source data 1. Raw data of panels a–d.