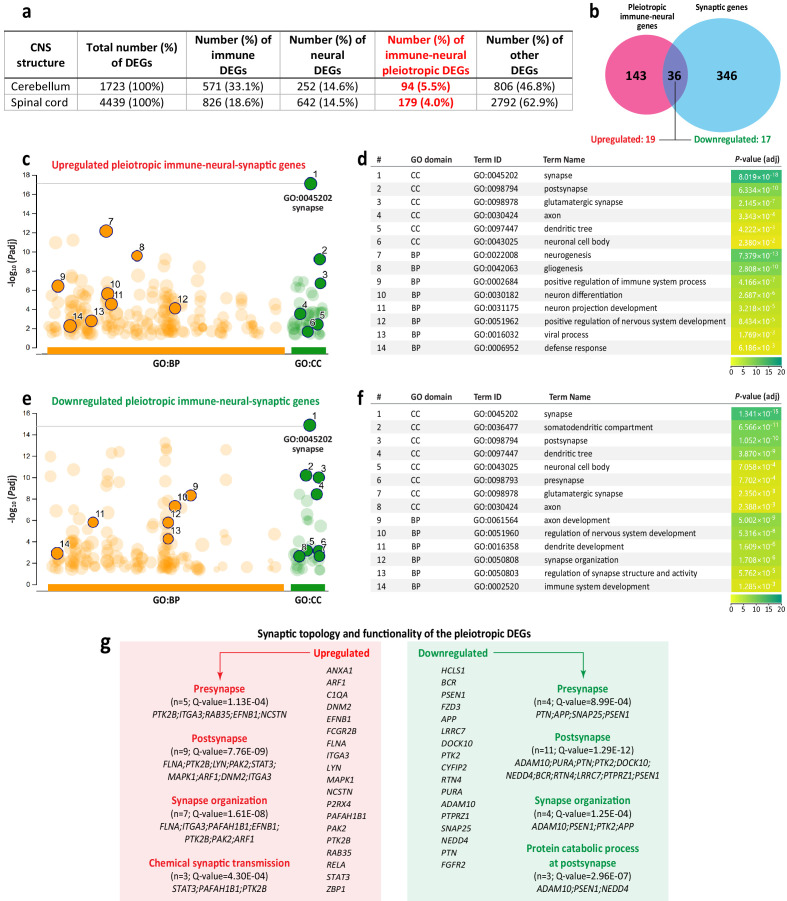
Figure 10. Identification and functional analysis of pleiotropic immune-neural-synaptic genes induced by West Nile virus (WNV) infection.
(a) Distribution of differentially expressed genes (DEGs) annotated to the immune or nervous system, or both (immune-neural pleiotropic DEGs; highlighted in red), relative to the total number of DEGs in indicated central nervous system (CNS) structures at the advanced-symptomatic stage of WNV neurological disease (WNV-ND). (b) Venn diagram shows the overlap (n = 36) between the immune-neural pleiotropic and synaptic DEGs in the spinal cord at the advanced-symptomatic stage of WNV-ND (numbers of the up- or downregulated genes in the overlap are indicated). (c–f) Select significantly enriched BP and CC GO terms (orange and green solid circles, respectively) and their respective statistical data (identified using gProfiler) for the upregulated (c and d) or downregulated (e and f) immune-neural-synaptic pleiotropic DEGs. (g) Gene symbols, significantly enriched SynGO terms, and respective statistical data for immune-neural-synaptic pleiotropic DEGs.

