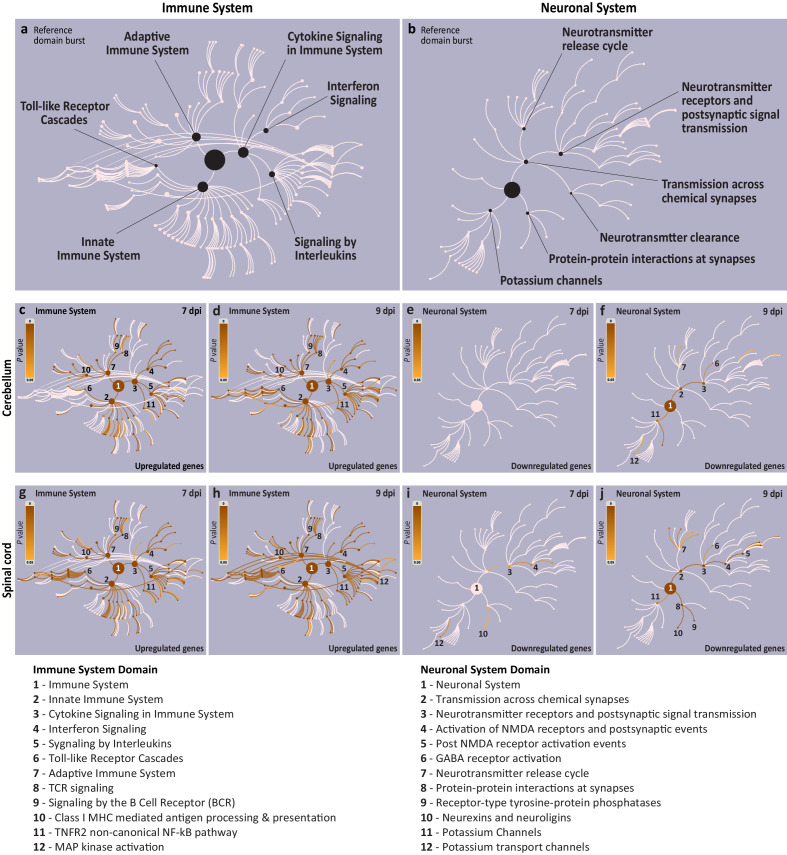
Figure 3. Visualization of the affected immune and neuronal system pathways during symptomatic stages of West Nile virus neurological disease (WNV-ND).
(a and b) Reference Reactome biological domain bursts for the immune system (a) and neuronal system (b). Each reference burst visualizes the pathways specific to a respective biological system. The largest central node of each burst corresponds to the uppermost level of the domain hierarchy and successive concentrically positioned nodes and arcs represent more specific pathway levels. The major pathway nodes are indicated for each system. (c–j) Diagrams illustrate the coverage of reference bursts for the immune system (c), (d), (g), and (h) or neuronal system (e), (f), (i), and (j) by pathways affected during the early-symptomatic (7 dpi) and advanced-symptomatic (9 dpi) stages of WNV-ND in the cerebellum (c–f) or spinal cord (g–j). Each diagram (c–j) displays the enriched pathway coverage by overlaying the reference domain bursts (light pink) with an orange gradient color based on the p-values derived from an overrepresentation test (reference gradient is provided in each diagram based on the range of p-values from 0 to 0.05; darker colors indicate smaller p-values). Select nodes/pathways are enumerated and listed in the legends at the bottom of the figure.

