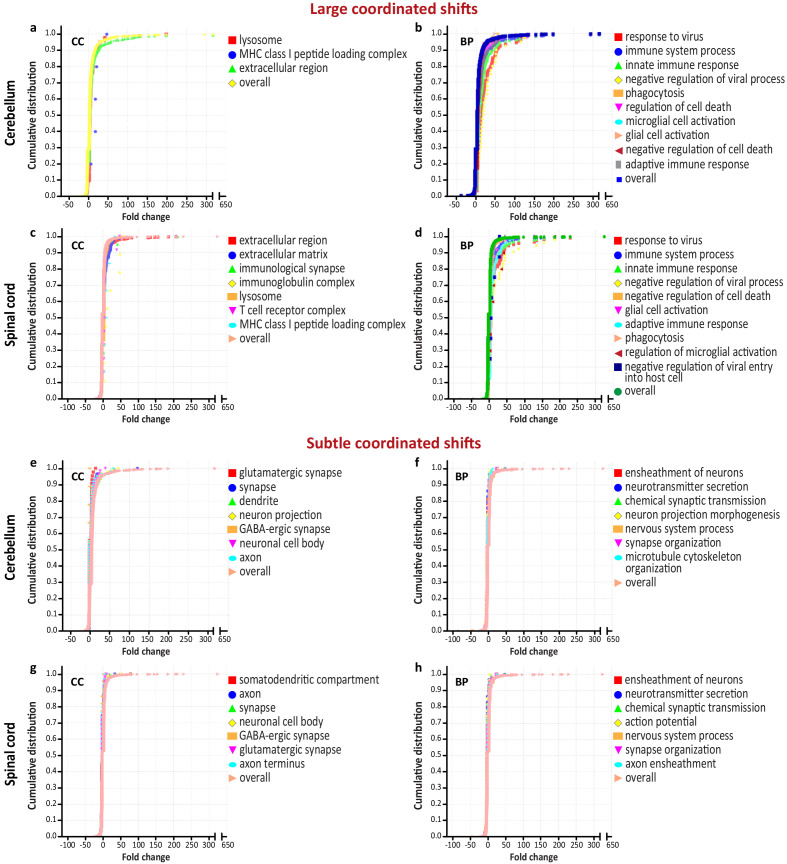
Figure 4. Coordinated transcriptional shifts during the advanced-symptomatic stage of West Nile virus neurological disease (WNV-ND).
(a–h) Graphs show the cumulative distribution of fold change values for groups of differentially expressed genes and select large coordinated shifts from the overall distribution (predominantly under the curve) (a–d) or subtle coordinated shifts from the overall distribution (predominantly above the curve) (e–h) in the cerebellum (a), (b), (e), and (f) and spinal cord (c), (d), (g), and (h). Significantly enriched GO terms (FDR < 0.05) for the plotted groups of genes are shown in the corresponding legends. BP, biological process; CC, cellular component; GO, gene ontology.

