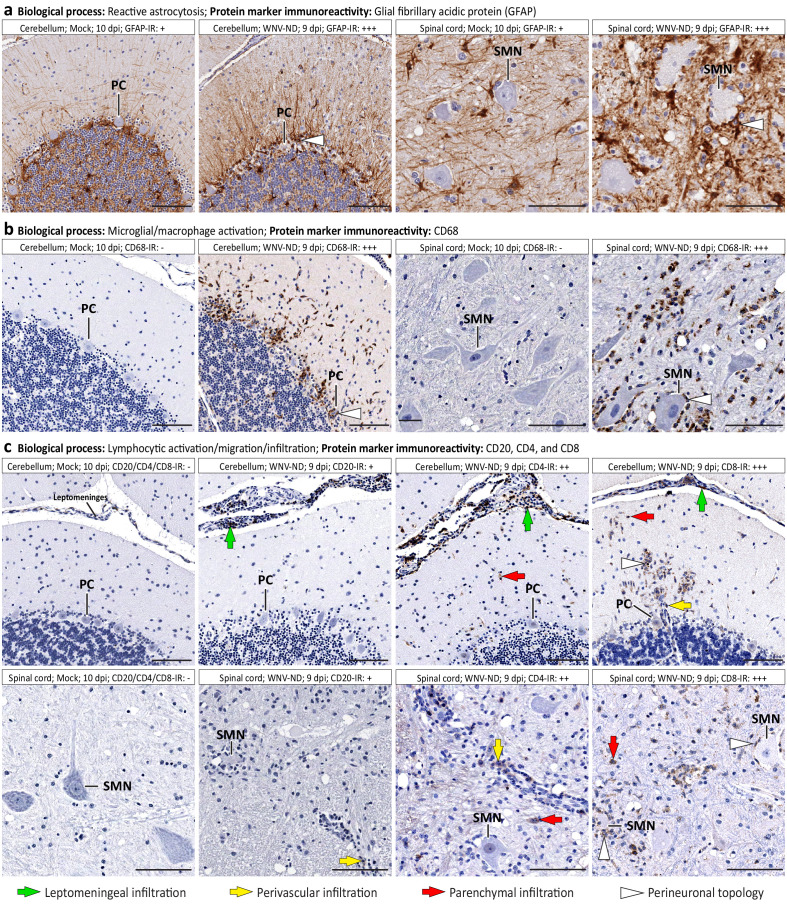
Figure 6. Immune cell morphology and topology during advanced-symptomatic West Nile virus neurological disease (WNV-ND).
Representative images illustrate major cellular immune responses (indicated in a–c) by displaying immunoreactivity (IR) for relevant protein markers (brown) in WNV-infected cerebellum and spinal cord versus mock. Labeling keys are provided at the bottom of the figure. Semi-quantitative assessment of the IR is as follows: -, negative; +, minimal; ++; moderate; +++, strong. PC, Purkinje cell. SMN, spinal motor neuron. Scale bars: 100 μm.

