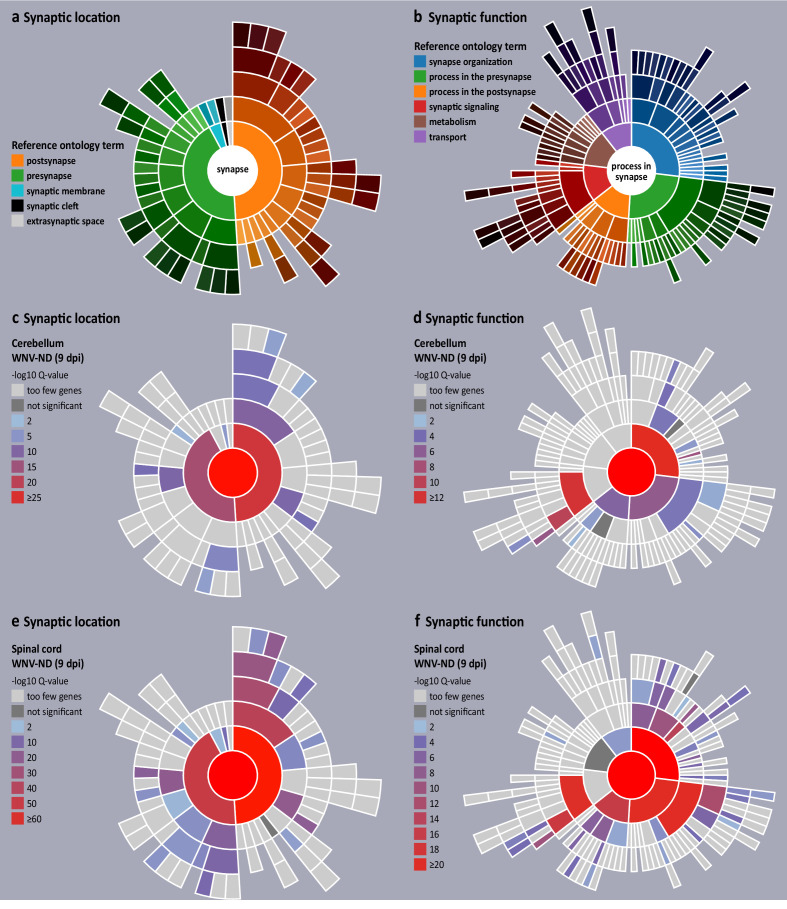
Figure 9. Visualization of transcriptional dysregulation of the synaptic organization and function in West Nile virus neurological disease (WNV-ND).
(a and b) Reference sunburst diagrams for synaptic location (a) and synaptic function (b) gene ontologies (GOs). The top-level GO terms ‘synapse’ and ‘process in synapse’ are at the center of corresponding sunbursts. GO terms representing major synaptic subcompartments (a) or synaptic functions (b) are positioned in the next level from the center, color-coded and shown in the legends. Child GO terms are positioned in the successive rings and colored by progressively darkening hues. (c–f) Transcriptional synaptic dysregulation in the cerebellum (c and d) and spinal cord (e and f) is visualized by the overlaying reference sunbursts with a color based on the -log10 Q values (FDR corrected raw p-values) for enriched synaptic GO terms. Specific synaptic GO terms are listed in Table 2. Stringent high-level evidence SynGO settings were applied.

