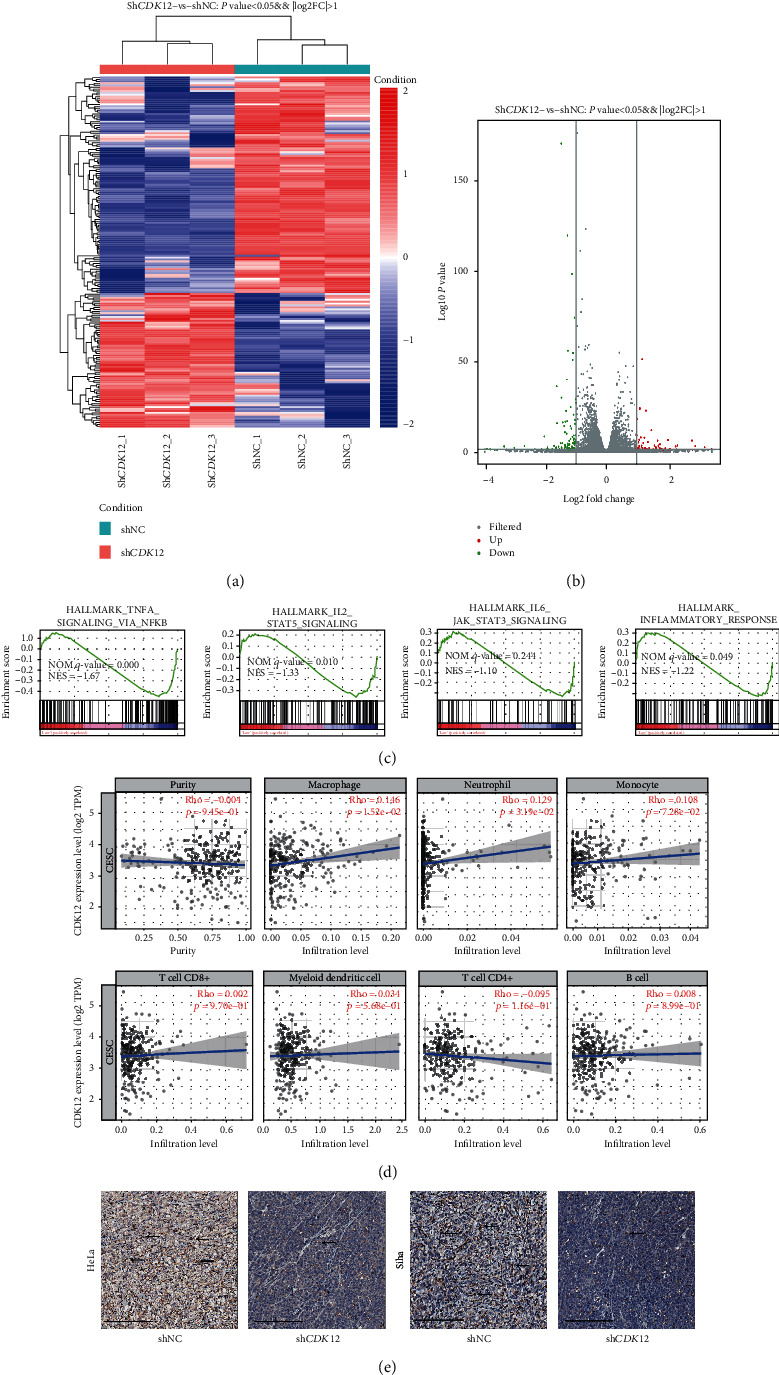
Figure 5.

High-expression of CDK12 enhances the macrophages infiltration. (a) Heatmap of the different genes by shRNA-mediated CDK12 knockdown. (b) Volcano plotting of the different genes by shRNA-mediated CDK12 knockdown. (c) Gene set enrichment analysis (GSEA) using hallmark gene sets by shRNA-mediated CDK12 knockdown. (d) The abundances of seven inflammatory/immune infiltrates (B cells, CD4+T cells, CD8+T cells, neutrophils, macrophages, monocyte, and dendritic cells) are estimated by the TIMER algorithm. (e) Typical IHC images of F480 from xenograft under HeLa and Siha cells treatment with sh-NC and shCDK12-1. Scale bar: 200 μm.
