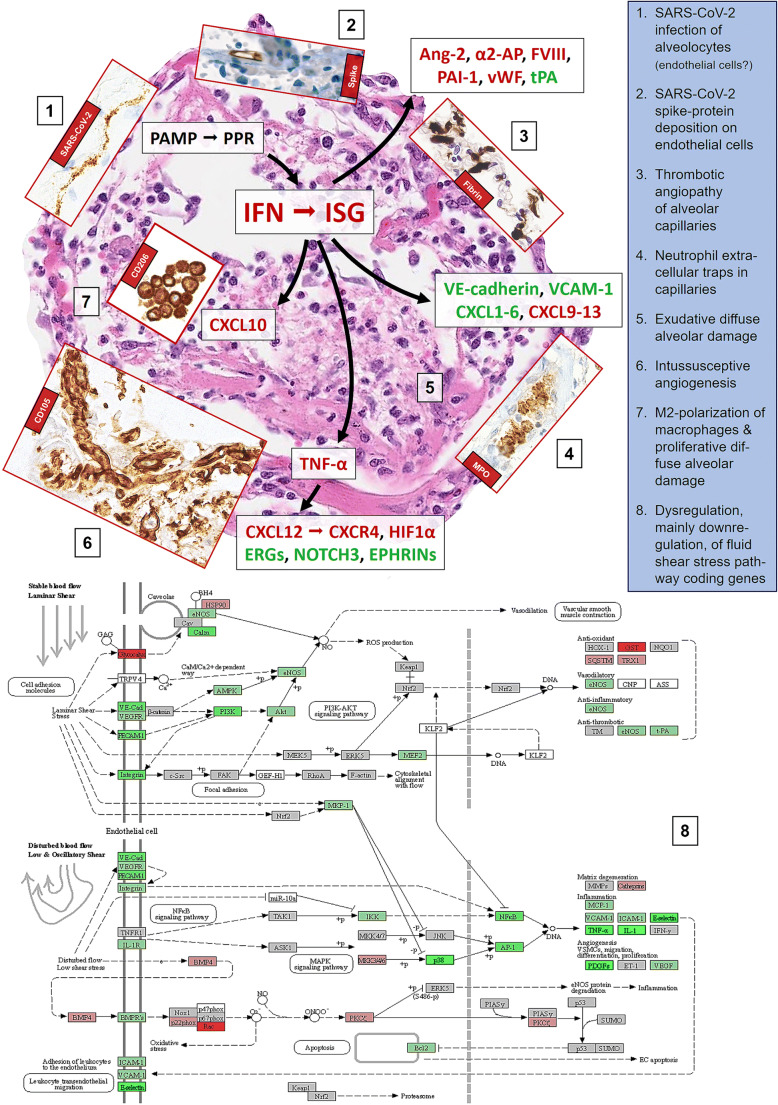
Fig. 2.
Scheme of the putative pathophysiological mechanisms of SARS-CoV-2 induced acute lung injury, mainly diffuse alveolar damage (background microphotograph (5); H&E, ×200), and microangiopathy and immunopathology in lethal (severe) COVID-19. Inserts, except for (1), are visualized by immunoperoxidase, microphotographed at ×400, and represent (1) SARS-CoV-2 in situ hybridization with the 845701 RNAscope probe - V-nCoV2019-S-sense and visualized with the RNAscope 2.5. LS detection kit (brown) from Advanced Cell Diagnostics (Hayward, CA, USA), yielding linear positivity of an alveolar septum; (2) immunohistochemical staining for SARS-CoV-2 Spike protein with the clone 007 from Sino Biological (Wayne, PA, USA), showing protein deposition on the inner side of an alveolar capillary; (3) immunohistochemical staining for fibrin with a polyclonal antibody A0080 from Dako (Glostrup, Denmark), revealing fibrin microthrombi casting the alveolar capillary network; (4) immunohistochemical staining for myeloperoxidase with a polyclonal antibody 760-2659 from Roche/Ventana (Rotkreuz, Switzerland), with neutrophilic granulocytes stuck into an alveolar capillary and displaying microscopic figures suggestive of neutrophilic extracellular traps (NET); (6) immunohistochemical staining for CD105 with the clone EPR10145-10 from Abcam (Cambridge, UK), showing a tight network of newly formed vessels in an alveolar septum; (7) immunohistochemical staining for CD206 with the clone E2L9N from Cell Signaling (Danvers, MA, USA), with significant amounts of intraalveolar M2 macrophages. (8) Kyoto Encyclopedia of Genes and Genomes (KEGG) diagram of disturbed fluid share stress pathways in COVID-19; respective gene expression profiles have been obtained on 25 lethal COVID-19 cases and compared to lungs of 5 patients suffering from arterial hypertension and 5 histopathologically unremarkable autopsy lungs that served as controls, utilizing the HTG EdgeSeq Oncology Biomarker Panel (HTG Molecular Diagnostics, Tucson, AZ, USA). The scheme should be looked at clockwise from 11 to 7. In general, upregulated genes/proteins are outlined in red, downregulated in green, indifferent ones in black

