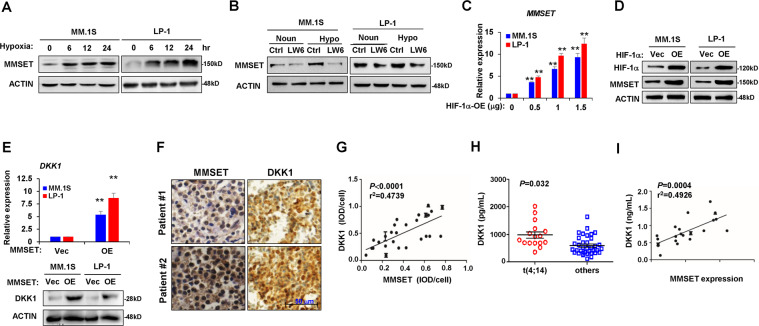
Fig. 3. HIF-1α induces MMSET expression in MM cells.
Western blot shows a MMSET protein levels in MM cells in hypoxia condition for up to 24 h and b MMSET level in MM cells treated with 10 μM of HIF-1α inhibitor LW6 for 24 h. MMSET mRNA expression by qPCR (c) and protein level by Western blot (d) in MM cells infected with lentivirus carrying HIF-1α overexpressing (OE) for 72 h. **P < 0.001 by one-way ANOVA for n = 3 independent experiments. (e) DKK1 expression in MM cells after lentivirus-mediated MMSET overexpression for 72 h by qPCR (upper penal) and by Western blot (lower panel). **P < 0.001 by Student’s t-test for n = 3 independent experiments. f Representative immunohistochemical staining for MMSET and DKK1 proteins in bone marrow biopsy specimens of the same patients. Scale bar, 50 μm. g Correlation coefficient between DKK1 and MMSET protein level in specimen of patients with MM (n = 26). P values were determined by Pearson coefficient. **P < 0.001 by one-way ANOVA for at least three independent experiments. h ELISA assay shows DKK1 level in bone marrow plasma of patients with t(4; 14) and other cytogenetic abnormal MM. i Correlation coefficient between bone marrow DKK1 level and MMSET expression in plasma cells of patients with MM with t(4; 14) (n = 17). P values were determined by Pearson coefficient.

