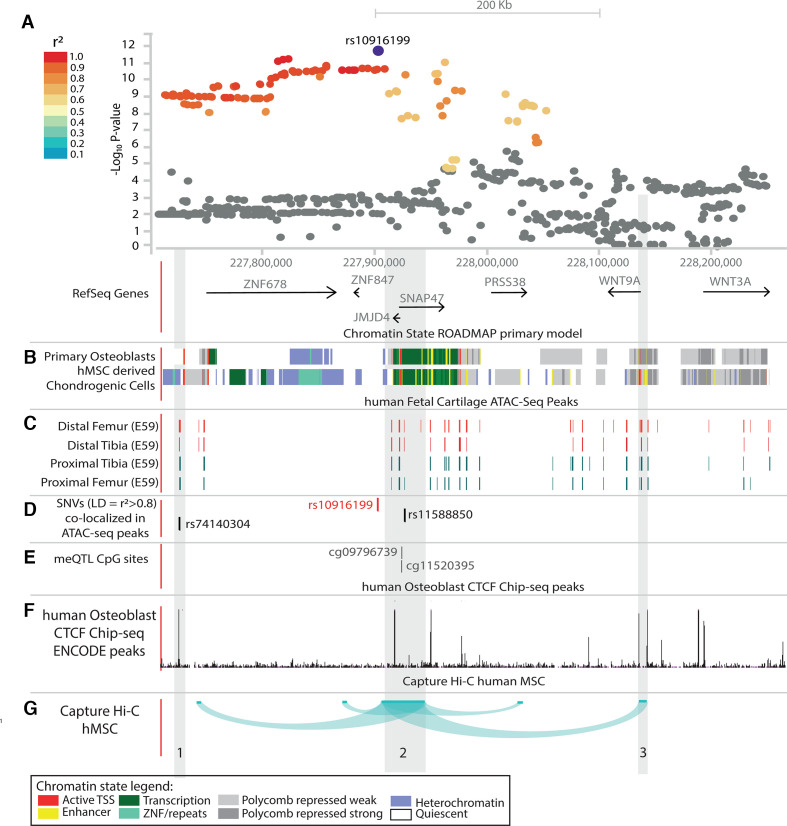
Figure 3.
Schematic overview of part of the rs10916199 locus. (A) LocusZoom plot of rs10916199 locus, the Y-axis depicts the −log10 p value of the single nucleotide variant (SNV) from the thumb Kellgren-Lawrence (KL)sum genome-wide association studies (GWAS). Colours depict the linkage disequilibrium (LD) (r2) between the variant and the LD SNV rs10916199. The X-axis depicts the relative genomic location, depict are the protein coding genes at those genomic locations. For this genomic region depicted in figure (B–G) are several epigenetic annotations are plotted. (B) Chromatin state, as predicted by the ROADMAP 15-state model on histone modifications, for primary osteoblasts and human mesenchymal stem cell-derived chondrocytes. Colours depict chromatin states, legend at bottom of full figure. (C). ATAC-seq peaks from human embryonic cartilage at different bone development sites at gestation day(E) 59. (D) Location of the lead SNV, rs10916199 and two putative causal SNVs which co-locative with ATAC-seq peaks. (E) Genomic location of rs10916199 meQTL CpG sites. (F) Chip-seq CTCF protein binding peaks from human primary osteoblasts from ENCODE. (G) Capture Hi-C chromatin interactions from three-dimensional (3D) genome browser for human mesenchymal stem cells (hMSC) and mesoderm. Depicted are the chromatin interactions from the promoters of the queried gene to the genomic location of interaction, this was done for the JMJD4/SNAP47 transcription start site (TSS), WNT9A TSS and the WNT3A TSS. For details on methods and underlying data, see online supplemental methods.

