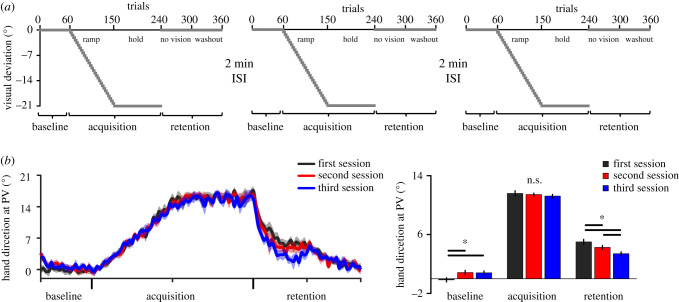
Figure 3.
Procedures and reaching performance of experiment no. 2. (a) Overview of the three identical sessions. The sessions were identical to those of experiment no. 1. Each session was separated by 2 min ISIs. (b) Left panel: hand direction at PV for the three sessions. Right panel: average hand direction at PV, shown separately for each phase of each session. Breakdown of a two-way interaction revealed that, in addition to replicating the results of the 2 min group of experiment no. 1, retention was further impaired in the third session as compared to the second one (all Cohen's dz > 0.616; medium to large effect sizes). For (b), error bars represent within-subject 95% CIs. Asterisks (*) indicate significant differences (p < 0.05). (Online version in colour.)

