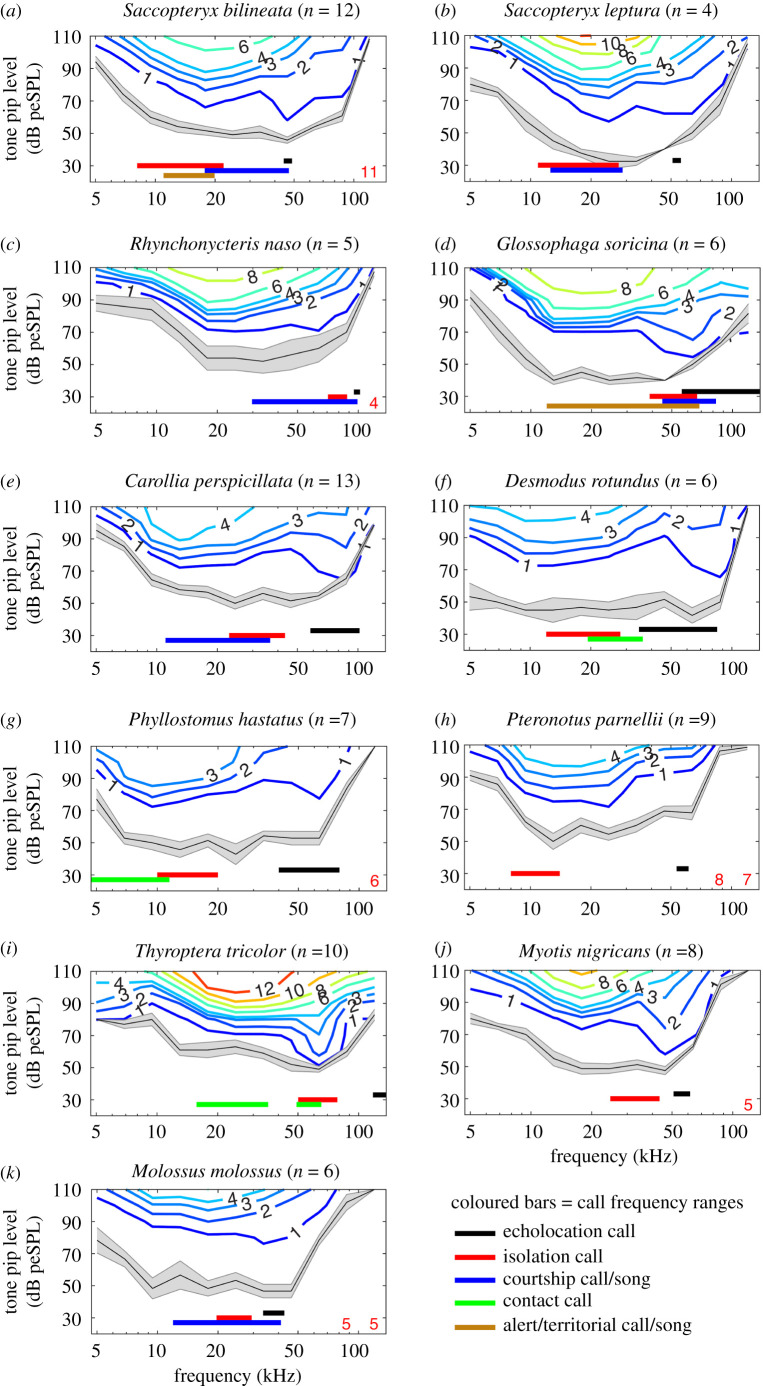
Figure 1.
Species-specific mean ABR thresholds calculated via bootstrap analysis for 11 species from six families: Emballonuridae (a–c), Phyllostomidae (d–g), Mormoopidae (h), Thyropteridae (i), Vespertilionidae (j) and Molossidae (k). The mean ABR threshold per species is depicted (black line; shading represents SEM). The isoresponse lines represent the strength of the ABR signal (colours and numbers indicate µV response strength). The number of animals measured per species is given in the plot titles (n). Vertical bars below the ABR thresholds indicate bandwidth of five different call types: echolocation calls (black), isolation calls (red), courtship calls (blue), contact calls (green) and territorial/alert calls (brown). For details, see electronic supplementary material, table S2. Red numbers on the bottom of the panels indicate the number of animals used for the calculation of mean and SEM (if less than total sample size). The numbers are positioned above the frequency for which mean values were determined.

