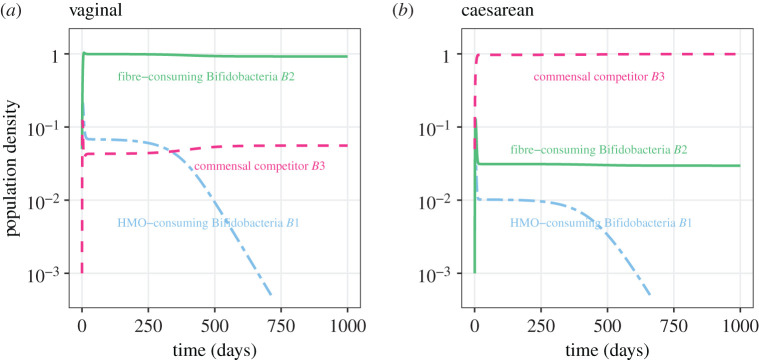
Figure 2.
Longitudinal dynamics of the three bacterial population abundances (on a log scale) using baseline parameter values in table 1 and initial conditions representing vaginal birth (a) and C-section (b). The blue two-dash line represents the infant-type Bifidobacteria B1, the green solid line represents the adult-type Bifidobacteria B2 and the red dashed line represents the commensal competitor B3. The dynamics are simulated for 3 years allowing the system to reach a post-weaning steady state. (Online version in colour.)

