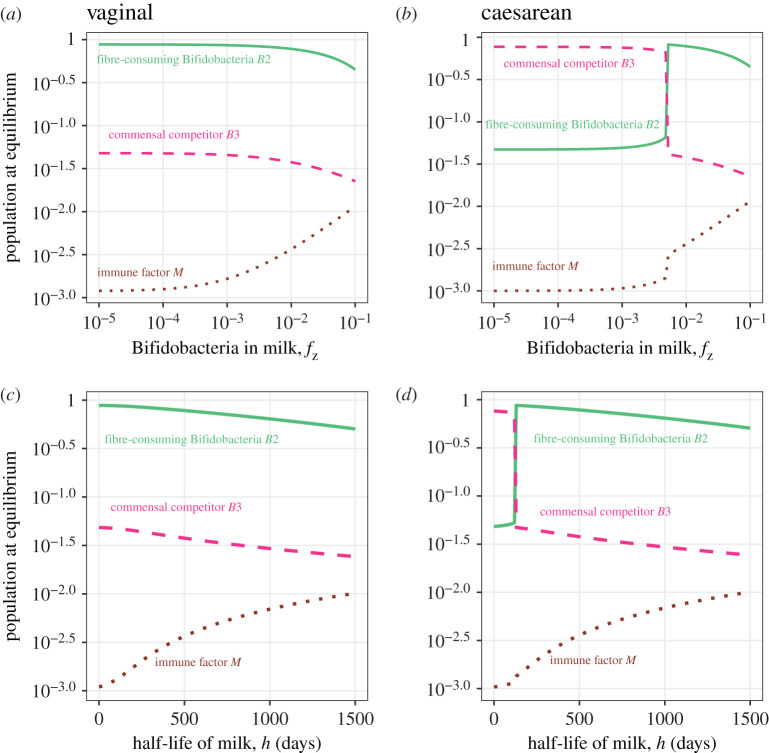
Figure 4.
Steady states of the three bacterial populations and the immune factor M in response to feeding practices. The simulations used the baseline parameter values in table 1 and the initial conditions representing vaginal birth (a and c) and C-section (b and d). The green solid line represents the adult-type Bifidobacteria B2, the red dashed line represents the commensal competitor B3 and the brown dotted line represents immune factor M. The y-axes are log-scaled population densities at equilibria. The x-axes are log-scaled Bifidobacteria levels carried by milk fz representing the amount of breast milk in diet (a and b), and the time h when milk takes up of the diet representing the duration of breastfeeding (c and d). (Online version in colour.)

