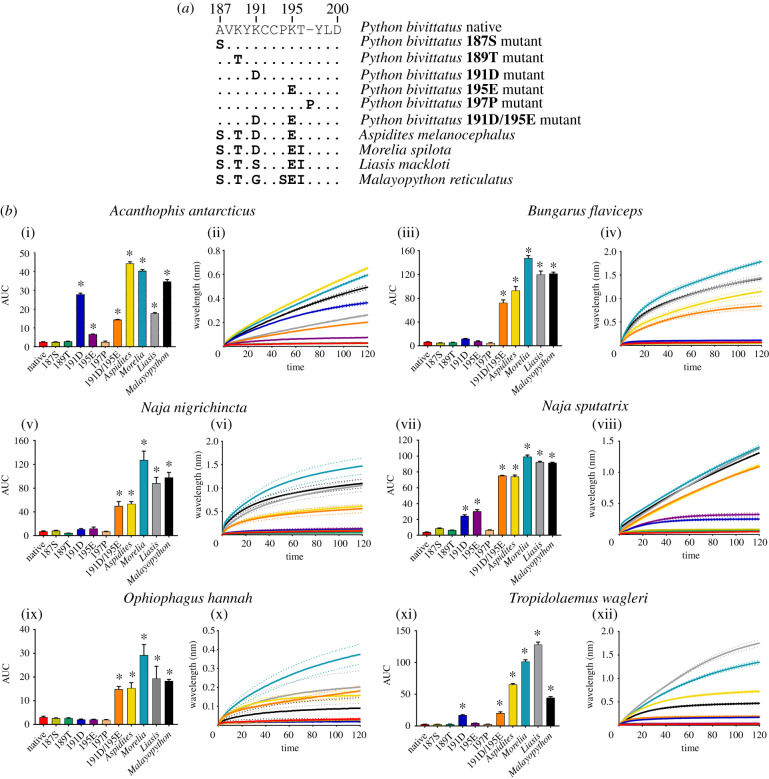
Figure 3.
The effects of venom from six elapid species against the Python bivittatus (native and mutants) and other Pythonidae representative mimotope sequences. (a) Amino acid sequences of native and mutant mimotopes. (b) Bar graphs represent the mean area under the curve (AUC) values of the adjacent curve graphs. Curve graphs show the mean wavelength (nm) shift in light with increased binding of venoms over a 120 s association phase. Each venom was tested in triplicate (n = 3). Error bars on all graphs represent the SEM. AUC values were statistically analysed using a one-way ANOVA with a Dunnett's multiple comparisons post hoc test comparing to the native mimotope. A statistical significance is annotated by * above the corresponding bar with a significance threshold of p < 0.01. All raw data and statistical analyses outputs can be found in electronic supplementary material, data S2. (Online version in colour.)

