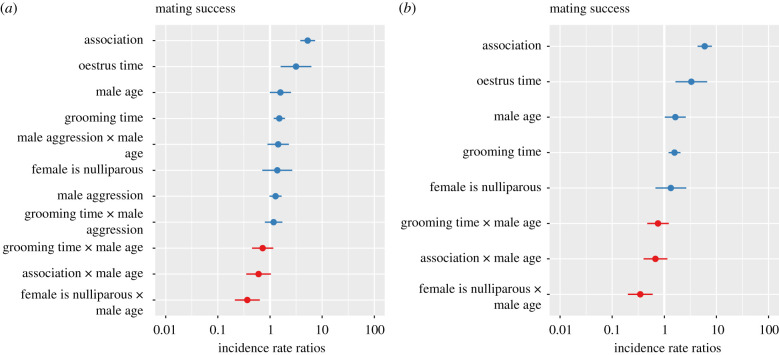
Figure 3.
Incidence rate ratio plots showing main effect predictors for the generalized linear mixed models that had the: (a) lowest AICc value and composed 57% of the model weight and (b) second lowest AICc value (ΔAICc = 1.38) and composed 29% of the model weight, in a comparison of 15 models (electronic supplementary material, table S2). In these models, the outcome variable was the number of times males and females mated (n = 1671 male–female pairs including 20 adolescent males, 10 young adult males, 57 reproductively available females, 14 of whom were nulliparas). (Online version in colour.)

