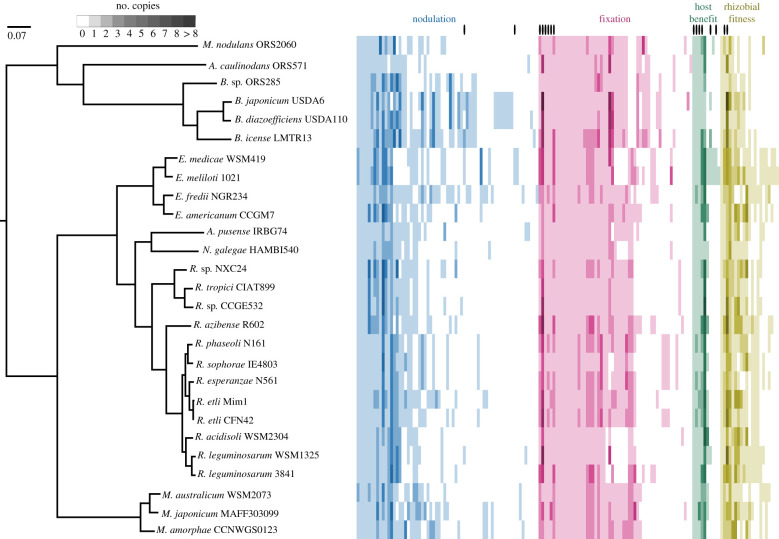
Figure 1.
Relationships among analysed strains and per genome number of symbiosis genes (one gene per column). The phylogenetic tree was constructed from concatenated single-copy core gene protein sequences using IQ-tree with the JTT + G4 model of evolution, scale bar is amino acid substitutions per site. Genus names abbreviated (in order from top to bottom: M. Methylobacterium, A. Azorhizobium, B. Bradyrhizobium, E. Ensifer, A. Agrobacterium, N. Neorhizobium, R. Rhizobium, M. Mesorhizobium). Genes in multiple categories are marked with a black oval. (Online version in colour.)

