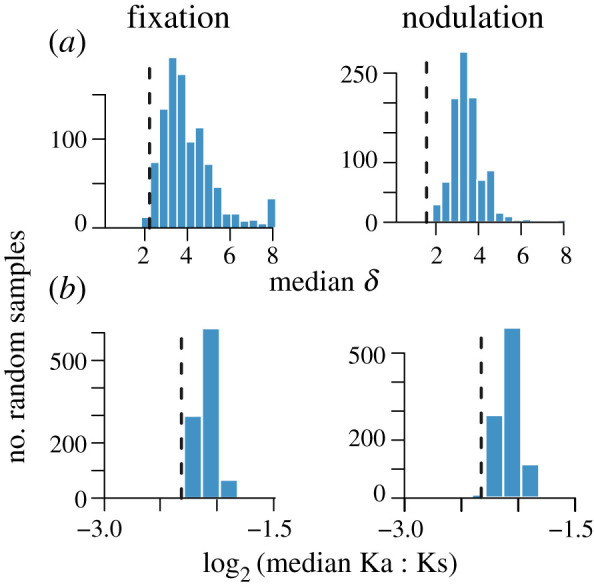
Figure 2.

Distribution of median δ (a; only genes with greater than or equal to 3 sequences) and median log2 Ka/Ks (b; only genes with greater than or equal to 3 comparisons) of 1000 randomly sampled sets of genes (bars) compared to the median values for symbiosis genes (dashed lines). Random samples are of genes found in the same number of strains and having similar copy number as symbiosis genes. δ is a measure of phylogenetic signal in the distribution among genomes with greater numbers indicating greater signal. (Online version in colour.)
