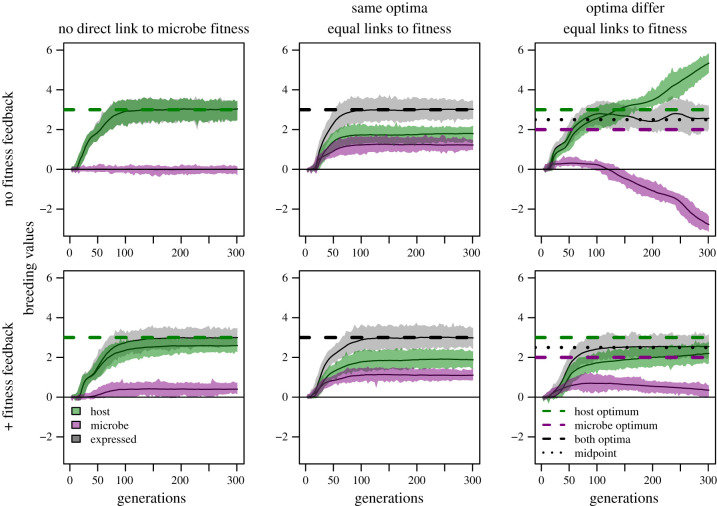
Figure 2.
Simulation results for different scenarios. Mean and range of breeding values for host (green) and microbes (purple), and expressed phenotype (grey). Trait optima or midpoints at dashed lines (see legend). Top left: a trait is directly linked to host fitness only. Top middle: a trait is directly linked to host and microbe fitness, with identical optima. Top right: trait is directly linked to both microbe and host fitness, at separate optima. Bottom row: as above, but host and microbe fitnesses are linked via positive fitness feedbacks.

