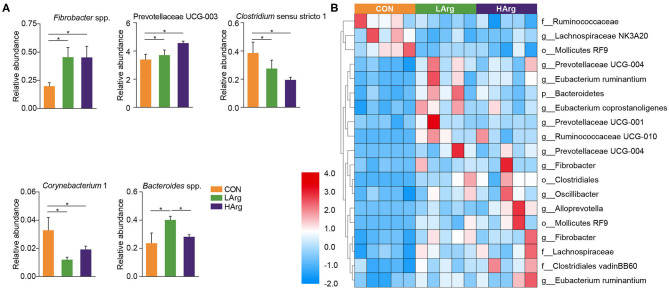
Figure 4.
Features characterizing the bacteria in the rumen of sika deer. Bar plots showing differences in the relative abundance of bacteria at genus level across three groups (A) and heat map showing the significant differences OTUs in the rumen of LArg and HArg groups comparing to CON group (B). *indicate P < 0.05.

