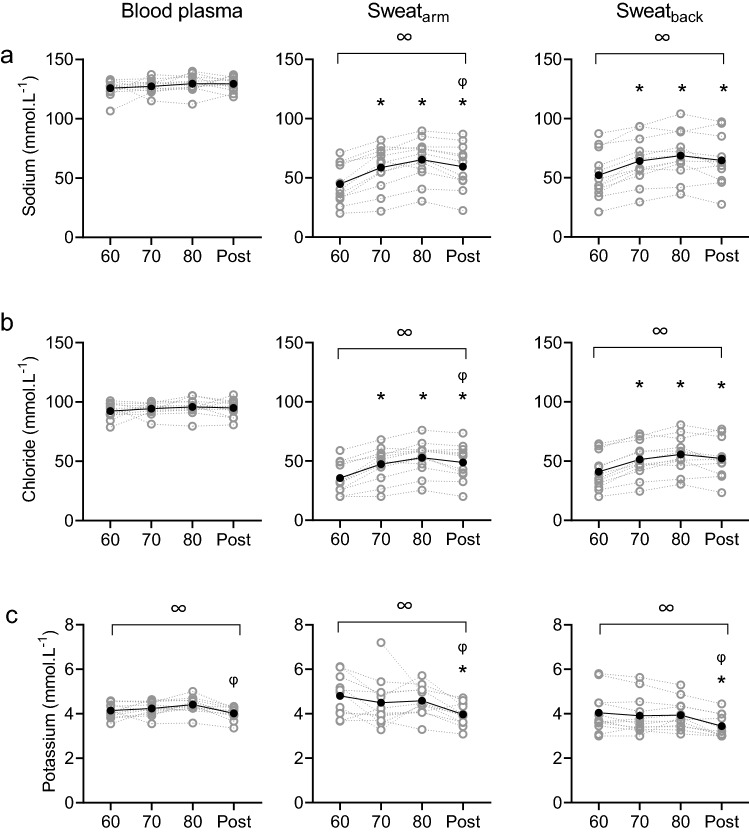
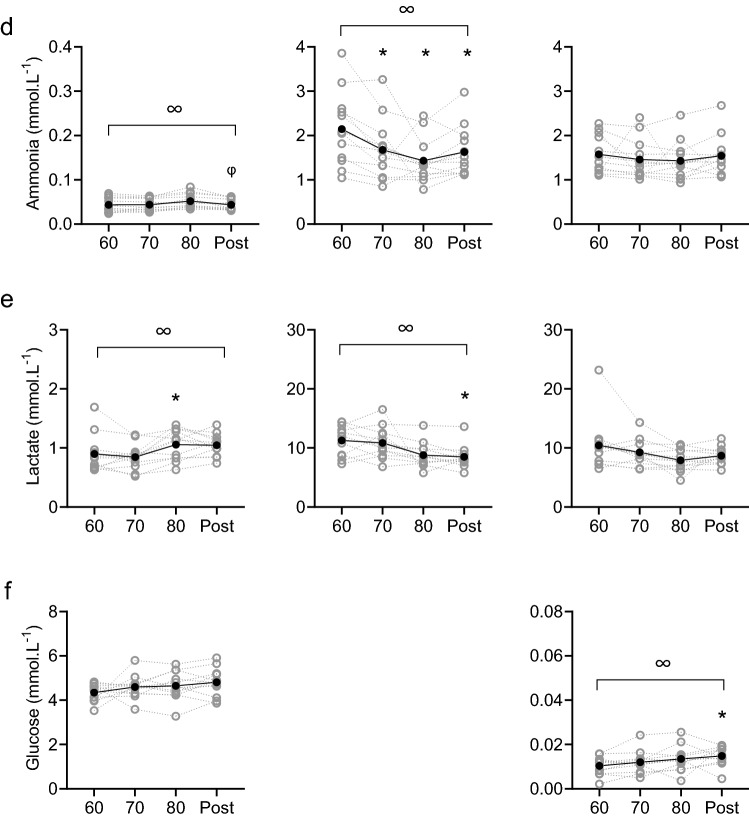
Fig. 1.
Sodium (a), chloride (b), potassium (c), ammonia (d), lactate (e) and glucose (f) concentrations in blood plasma (left panels), upper arm sweat (central panels) and upper back sweat (right panels) during incremental cycling (60%, 70%, 80% HRmax) and post-exercise (post) in the heat (33 °C, 65% RH; n = 12). Grey symbols and lines represent individual data. Black symbols and lines represent group averages. Sweat samples on the arm were not analysed for glucose. Note that axes for blood and sweat ammonia, lactate and glucose differ. ∞ denotes significant (P < 0.05) main effects of exercise intensity. * denotes significant differences from 60% HRmax. φ denotes significant differences from 80% HRmax


