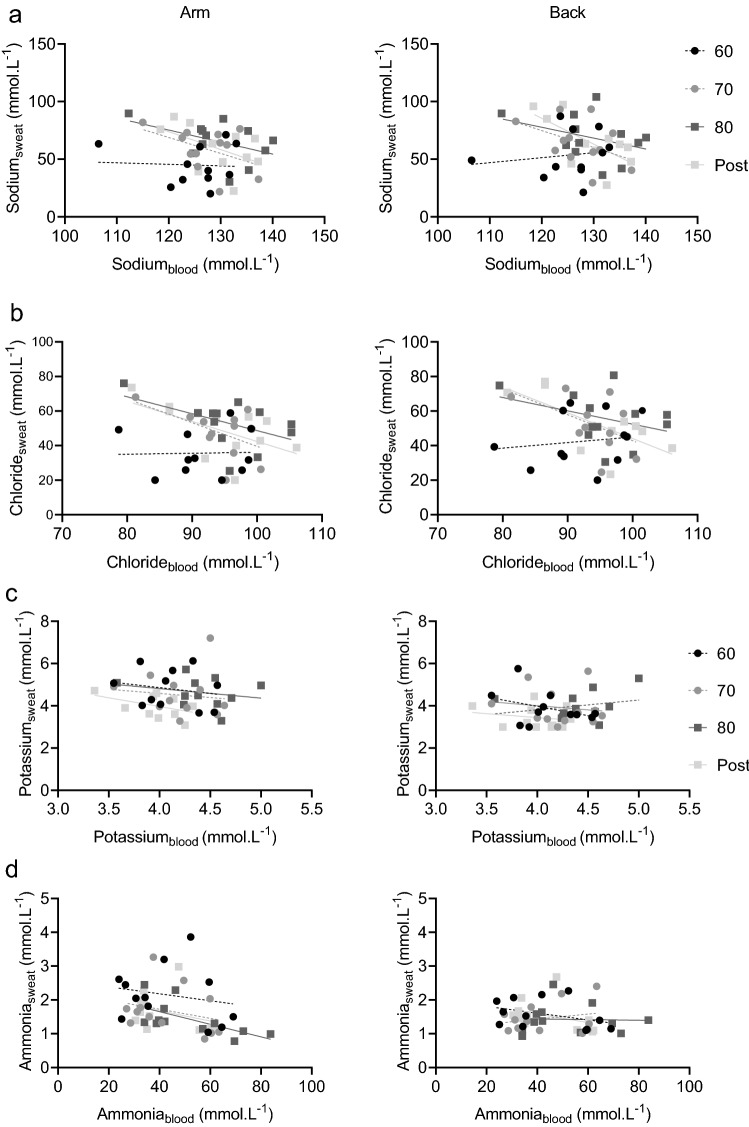
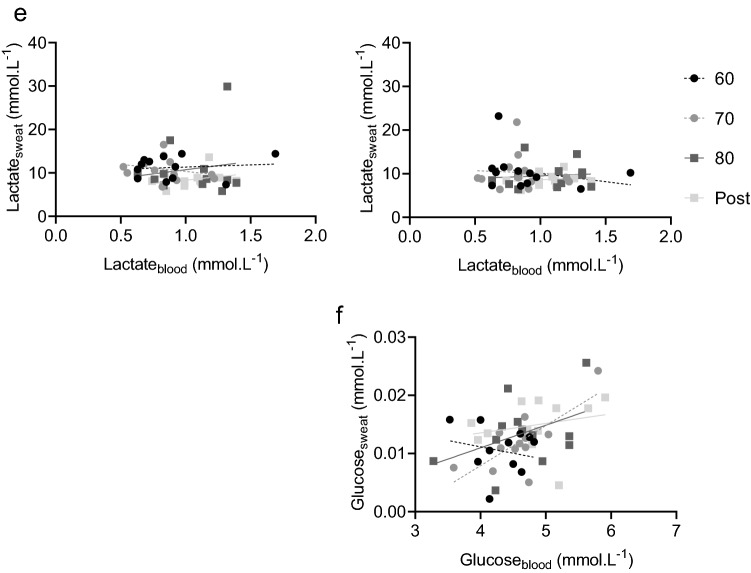
Fig. 2.
Correlations for sodium (a), chloride (b), potassium (c), ammonia (d), lactate (e) and glucose (f) concentrations in blood plasma and upper arm sweat (left panels) and upper back sweat (right panels) during incremental cycling in the heat (33 °C, 65% RH; n = 12). Black circles with and a dashed regression line represent 60% HRmax (60), grey circles and a dashed line represent 70% HRmax (70), dark grey squares and a solid line represent 80% HRmax (80) and light grey squared and a solid line represent post-exercise (post). Corresponding correlation coefficients can be found in Supplemental Table 1


