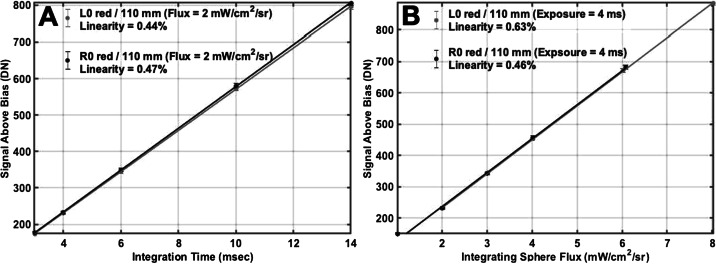
Fig. 14.
Example of Mastcam-Z linearity in response to changing integration time (A) and flux (B). In both cases, the cameras nonlinearity is . Nonlinearity from increasing flux (B) appears slightly larger than nonlinearity from increasing exposure time (A). Reported DN represent the average signal above bias in a pixel box at the center of the CCD from the photon transfer dataset using the L0/R0 filters and the 110 mm zoom setting ()

