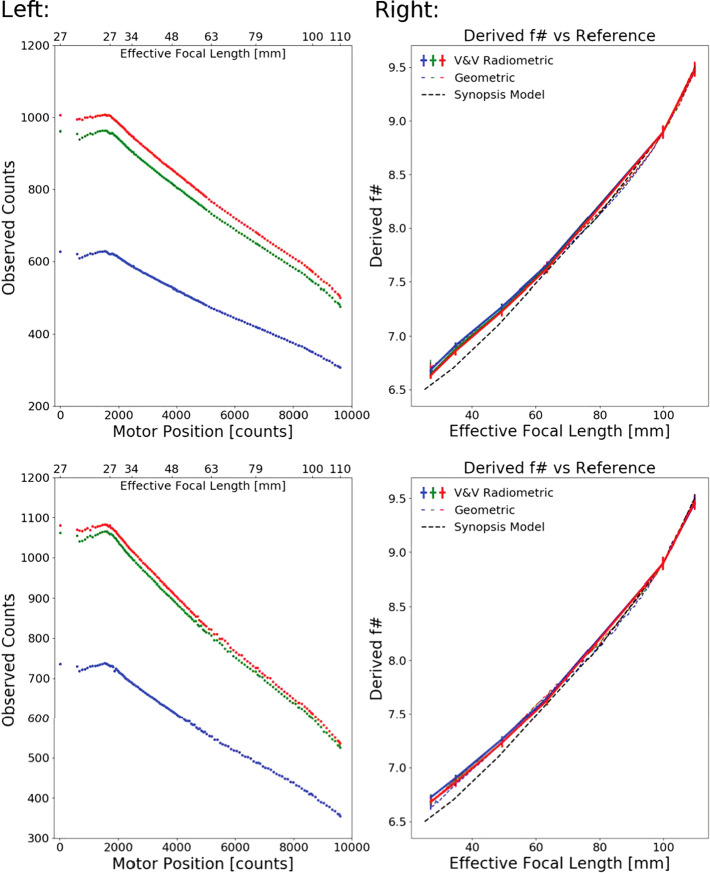
Fig. 19.
Observed DN as a function of focal length and the derived corresponding change in , with R, G, and B pixel values plotted in red, green and blue respectively. (A) Observed counts for a fixed scene in the geometric data. A sub-image constant to all zoom levels was used for the analysis to preserve illumination conditions. The lamps and target reflectance are such that the green and red pixels measured a comparable signal. (B) The derived as a function of focal length, assuming a quadratic dependence on the change in with effective focal length. Also plotted are the derived values of the from data acquired during V&V testing with an integrating sphere at constant flux of 3.8 and integration time of 20 ms. The conversion from motor position to focal length is taken from data acquired during V&V testing. See text for more details. (C) and (D) correspond to the same measurements as (A) and (B) but for the right Mastcam-Z

