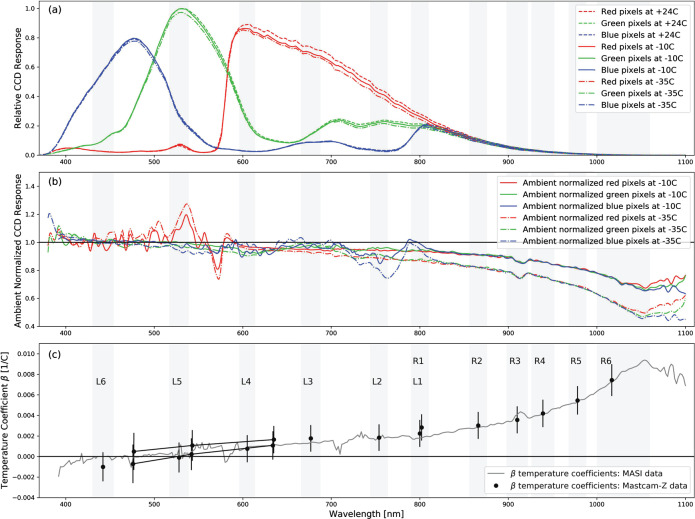
Fig. 24.
Three monochromatic scans at varying temperature confirmed an approximately linear decrease of quantum efficiency for wavelengths between 400 nm and 1100 nm. Panel (a) is the normalized response of MASI at three temperatures when the mono-chronometer’s light was focused on the detector without any filters in the beam. Notice that each of three Bayer-pattern colors behave differently until about 800 nm. Although MASI’s response greatly decreases in the infrared, there is enough signal for a robust measurement up to nm. Panel (b) shows the C and C curves divided by the ambient C curves. Panel (c) shows MASI’s linear fitting of the temperature coefficient versus wavelength. The black dots are approximate measurements derived from the TVAC tests with Mastcam-Z. The disagreement between filters 0 and 1 is likely the result of slight difference in ISOP values during testing

