
Fig. 25.
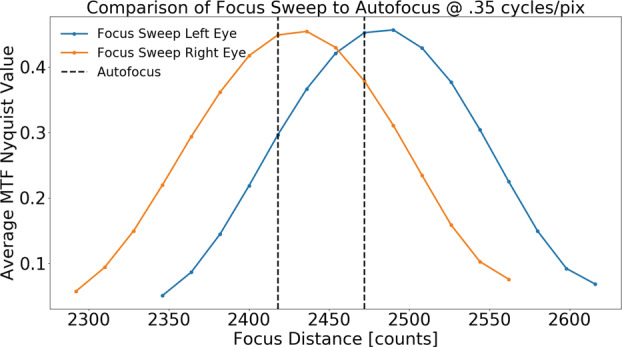
Comparison of the measured best focus position to that determined by the autofocus algorithm. For each camera, a series of images were acquired at varying focus positions, with the average MTF Nyquist value calculated at each position. The highest MTF value corresponds to best focus. The blue and orange lines represent the left and right Mastcam-Zs, respectively. The dotted line plots the best focus position as determined by an autofocus frame on the same target. Good agreement is found between the focus stacks and autofocus algorithm