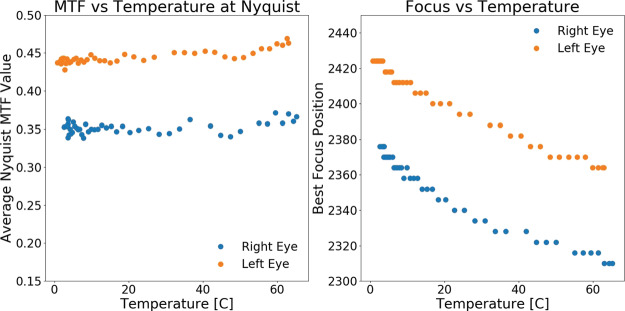
Fig. 27.
An analysis of measured MTF vs temperature with autofocus. Left: Derived average Nyquist MTF values as a function of temperature from a series of auto-focused frames at 100 mm at a target distance of 3 m. With the appropriate correction in focus motor position, the highest achievable MTF remains constant as a function of temperature. Right: Plot demonstrating the required change in best-focus motor position as a function of temperature

