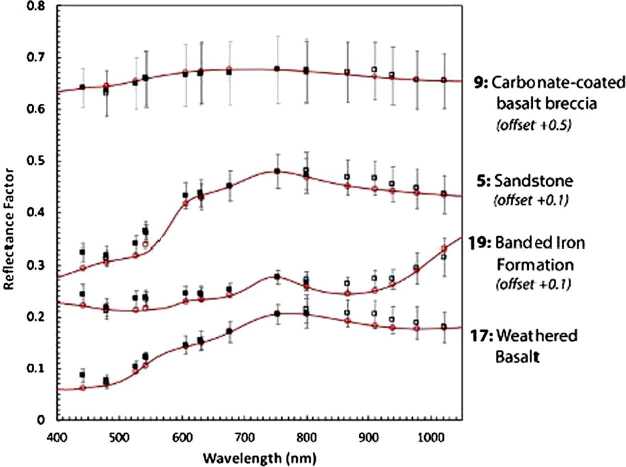
Fig. 39.
High-resolution laboratory spectra of Geoboard rock targets (solid red lines) and lab spectra convolved to Mastcam-Z bandpasses (open red circles) compared to Mastcam-Z reflectance measurements (Mastcam-Z left = filled black squares; Mastcam-Z right = open black squares). Lab spectra shown were acquired with the contact probe and were normalized to the reflectance value of the Mastcam-Z measurement at 754 nm. Some spectra have been offset for clarity. Root mean square errors between the two datasets are for all rock targets shown. Error bars shown represent the standard deviation of the Mastcam-Z pixels averaged in each region of interest. Target numbers correspond to the labels on Fig. 38

