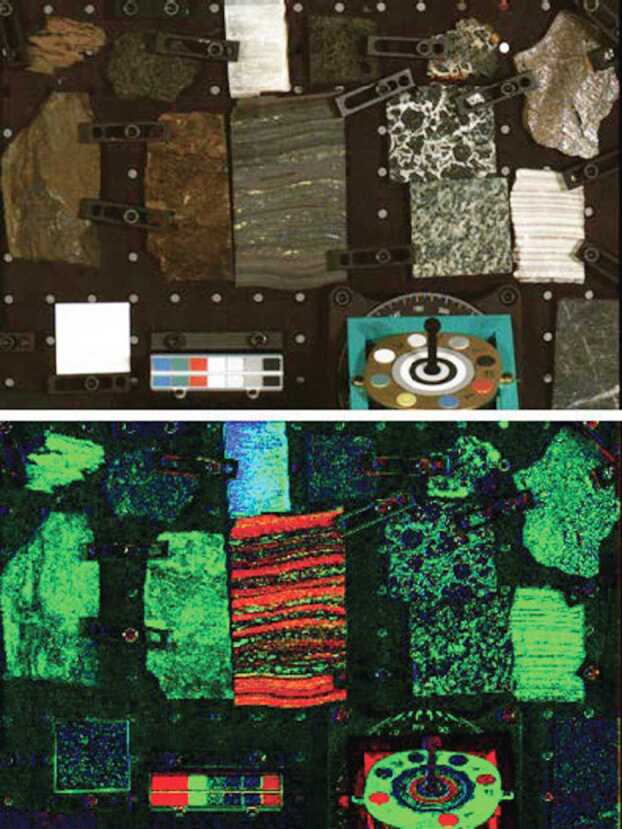
Fig. 40.

Cropped Mastcam-Z Right 63 mm zoom image of the center of the Geoboard. Above: visible color (R0 filter, Bayer RGB). Below: RGB composite of three parameters that highlight mineralogic variations among the targets. Red = 866 nm band depth (0.05 min, 0.20 max), relative to continuum wavelengths at 637 nm and 1014 nm (consistent with crystalline hematite); green = positive 474 nm to 637 nm slope (0.0 min, + 0.001 max) (consistent with Fe-oxides); blue = negative 939 nm to 978 nm slope (0.0 min, −0.0001 max) (consistent with hydration). For scale, the grid holes on the board have 1 inch spacing
