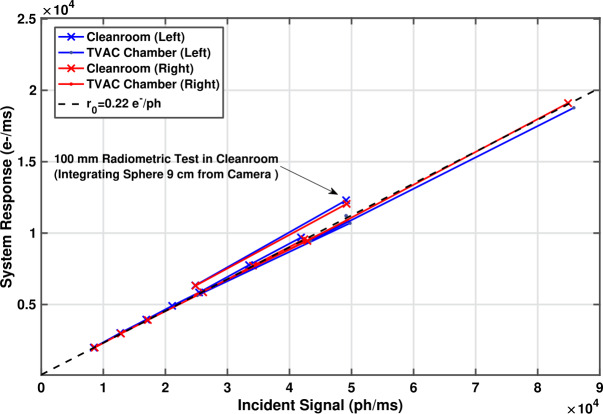
Fig. 43.
Comparison of L0/R0 radiometric results for all integrating sphere configurations from both the radiometric (Sects. 3.6 and 3.7) and photon transfer (Sect. 3.3.1) datasets obtained in the cleanroom and TVAC chamber. The x-axis shows expected signal in , calculated using Equation (1). The y-axis shows observed response of the central pixels in (). The slope of the line is the system responsivity . With the exception of the 100 mm radiometric dataset from the cleanroom, all observations are consistent to within regardless of zoom position or integrating sphere configuration

