
Fig. 6.
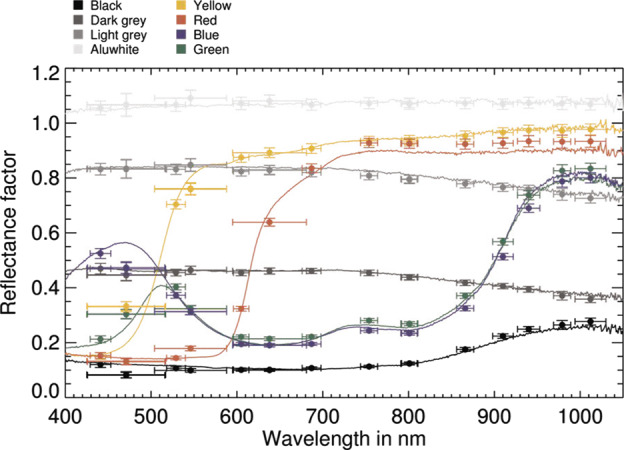
Laboratory reflectance (lines, ) at incidence , emission , and calibrated Mastcam-Z values (dots with error bars) of calibration target witness samples derived from 34 mm observations of the Geoboard made during stand-alone testing (see Sect. 3.12). For details on laboratory characterization of calibration target color and grayscale materials see Kinch et al. (2020, this journal). Mastcam-Z values were derived using the techniques described in Sect. 4.1.7