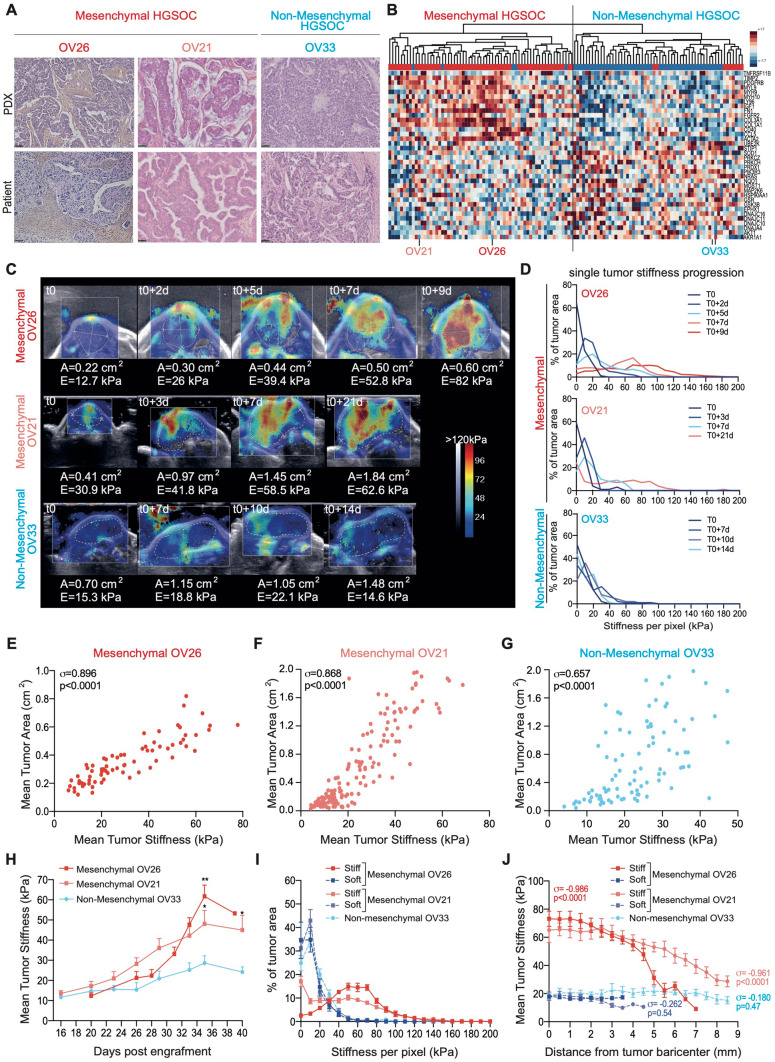
Figure 1.
Tumor stiffness increases with growth of mesenchymal HGSOC. (A) Representative views of HES staining from PDX mouse models (Up) and corresponding human HGSOC (Bottom). Mesenchymal (OV26, OV21) and Non-Mesenchymal (OV33) PDX are shown. Scale bar, 50 μm. (B) Hierarchical clustering using Euclidean distance and Complete agglomeration method based on Mesenchymal and Non-Mesenchymal gene signatures (defined in29) from Institut Curie’s HGSOC data set. Each row represents a gene, and each column a tumor, with 107 HGSOC patients and 13 PDX. OV26, OV21 and OV33 are indicated. Blue and red squares indicate gene expression in each tumor below and above the mean, respectively. Color saturation indicates magnitude of deviation from the mean. The dendogram of samples (above the matrix) allows classification of patient and PDX in Mesenchymal (red) and Non-Mesenchymal (blue) subgroups. (C) Representative colored stiffness maps in the transverse plan of Mesenchymal and Non-Mesenchymal PDX tumor growth over time. Colored map represents the Young’s modulus value (E) for each pixel, stiffness scale ranging from 0 kPa (blue) to 120 kPa (red). Dotted lines, drawn by hand, delineate tumor border and area. t0 corresponds to the first day of tumor stiffness measurement, and the following days of measures are indicated. (A) Stands for tumor area and (E) for mean tumor stiffness per pixel at each time point. (D) Variations of stiffness values in tumor area over time. The total tumor area occupied by pixels of a specific stiffness value (pixel stiffness range: 0 to 200 kPa), inside the same representative tumor as in (C), from t0 and all along measurements (d, in days) in PDX models. Data are expressed as percentages rather than in bins in order to compensate for the increasing number of pixels obtained as tumors grow. (E–G) Correlation plots between mean tumor stiffness and mean tumor area upon growth of tumors from Mesenchymal OV26 (n = 22) (E) and OV21 (n = 30) (F), and Non-Mesenchymal OV33 (n = 18) (G) PDX models. Each dot refers to a single tumor measurement at a given time. The number of measures per tumor (m = 73 (E), 156 (F), 91 (G)), depends on the PDX follow-up duration limited by ethical concerns. Correlation coefficient σ and P value are based on Spearman’s rank correlation test. (H) Mean tumor stiffness curves over time for Mesenchymal OV26 (n = 20) and OV21 (n = 22) (F), and Non-Mesenchymal OV33 (n = 16) PDX models. P values are based on Welch's t-test. (I) Histograms of stiffness values in tumor area. The total tumor area occupied by pixels of a specific stiffness value (pixel stiffness range: 0 to 200 kPa) between soft and stiff Mesenchymal OV26 (soft: dark blue dashed line, n = 8; stiff: red line, n = 7), soft and stiff Mesenchymal OV21 (soft: purple dashed line, n = 13; stiff: light red line, n = 9) and Non-Mesenchymal OV33 (soft: light blue dashed line, n = 15) tumors. Data are expressed as percentages of tumor area rather than in bins in order to compensate for the increasing number of pixels obtained as tumors grow. (J) Correlation plot between stiffness value of each pixel and distance from the tumor barycenter in Mesenchymal OV26 (soft n = 8; stiff: n = 8) and OV21 (soft n = 13; stiff n = 9) and Non-Mesenchymal OV33 (soft n = 15) tumors. Correlation coefficients σ and P value are based on Spearman’s rank correlation test.

