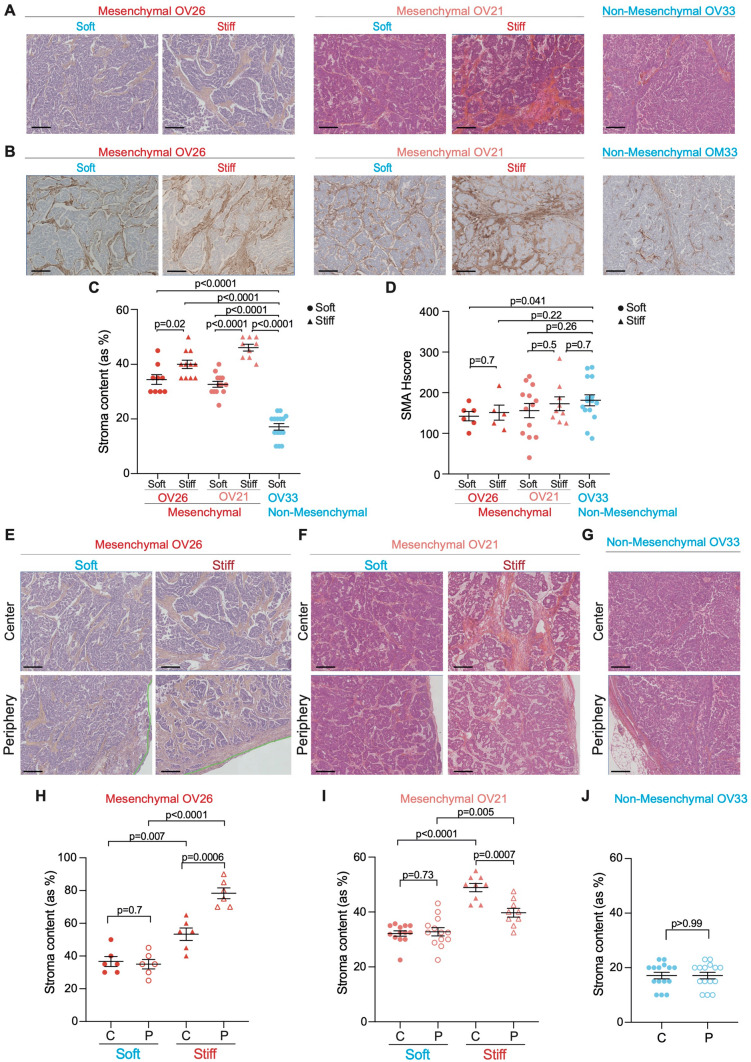
Figure 2.
Tumor stiffness is associated with high myofibroblast content in Mesenchymal HGSOC. (A) Representative views of HES staining showing stromal (orange) and epithelial (pink) compartments in soft and stiff Mesenchymal and Non-Mesenchymal tumors. Scale bar, 200 μm. (B) Same as in (A) showing smooth muscle α-actin (SMA) immunostaining. (C) Scatter plot showing percentages of stroma in soft (dot) versus stiff (triangle) Mesenchymal (OV26: soft n = 9, stiff n = 11; OV21: soft n = 13, stiff n = 9) and Non-Mesenchymal (n = 15) HGSOC. Data are shown as mean ± S.E.M. P values from Mann Whitney test. (D) Same as in (C) showing SMA histological scores (Hscores). P values from Welch's t-test. (E–G) Same as in (A) at the center (top) and periphery (bottom) of soft (left) and stiff (right) Mesenchymal (E,F) and Non-Mesenchymal (G) HGSOC. (H–J) Scatter plot showing percentages of stroma at the center (C, plain) and periphery (P, empty) in soft (dot) versus stiff (triangle) Mesenchymal (OV26: soft n = 6, stiff n = 6) (H); (OV21: soft n = 13, stiff n = 9) (I) and Non-Mesenchymal (n = 15) (J) HGSOC. Data are shown as mean ± S.E.M. P values from Welch's t-test.

