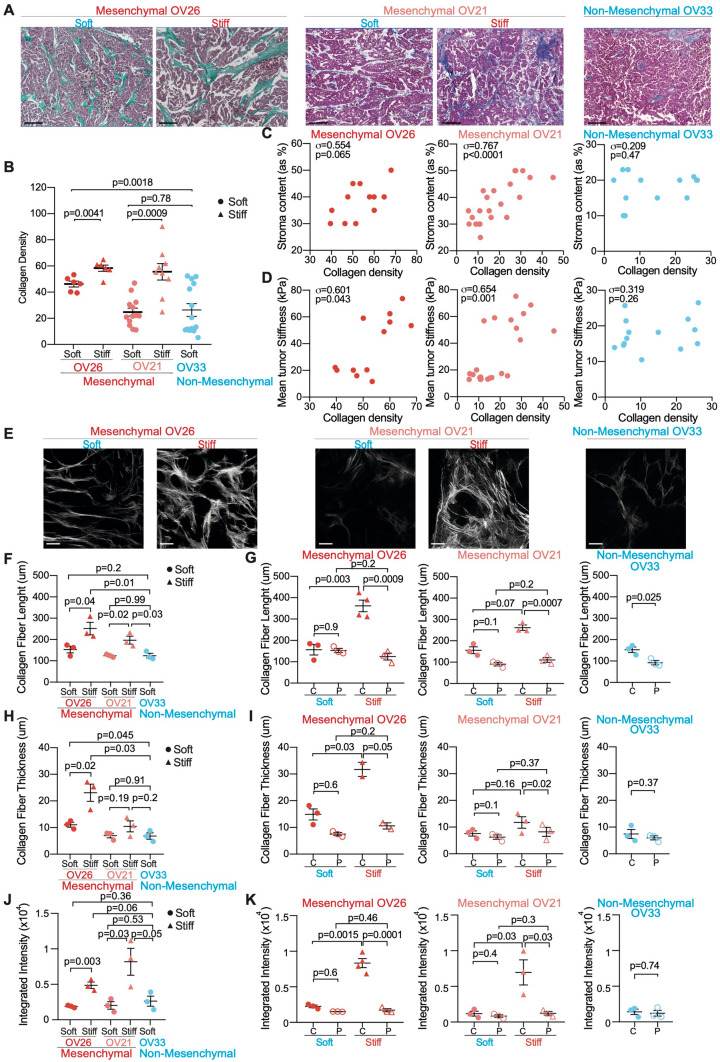
Figure 3.
Tumor stiffening is correlated with collagen remodeling in Mesenchymal HGSOC. (A) Representative views of Masson’s trichrome staining showing nuclei (dark purple), cytoplasm (purple) and collagen (green/blue) in soft and stiff Mesenchymal and Non-Mesenchymal HGSOC. Scale bar, 200 μm. (B) Scatter plot showing collagen density in soft (dot) and stiff (triangle) Mesenchymal (OV26: soft n = 6, stiff n = 6; OV21: soft n = 13, stiff n = 9) and Non-Mesenchymal (n = 15) tumors. Data are shown as mean ± S.E.M. P values from Welch's t-test. (C) Correlation plots between stroma content (as percentage of total tumor section) and collagen density (evaluated using image J software110, see “Methods”) in Mesenchymal (OV26: n = 12; OV21: n = 22) and Non-Mesenchymal (n = 14) HGSOC. Correlation coefficients σ and P values are based on Spearman’s rank correlation test. (D) Same as in (C) between mean tumor stiffness (kPa) and collagen density. (E) Representative projected stack images of SHG signal in soft and stiff Mesenchymal and Non-Mesenchymal tumor sections. Scale bar, 100 μm. (F,H,J) Scatter plots showing collagen fiber length (F), thickness (H) and integrated density (see “Methods”) (J) in soft (dot, n = 3) and stiff (triangle, n = 3) Mesenchymal and Non-Mesenchymal (n = 3) tumor sections. Around 100 collagen fibers were measured in at least 10 representative regions per tumor. Data are shown as mean ± S.E.M. P values from Unpaired t-test. (G,I,K) Same as in (F,H,J) showing collagen fiber length (G), thickness (I) and integrated density (i.e. product of area and mean grey value) (K) at center (C, plain) or periphery (P) of soft (n = 3) and stiff (n ≥ 2) Mesenchymal and Non-Mesenchymal (n = 3) tumor sections. Around 100 collagen fibers were measured in at least 10 representative regions per tumor. Data are shown as mean ± S.E.M. P values are based on Paired t-test when comparing center versus periphery of the same tumor and Welch’s t-test when comparing soft versus stiff tumors.

