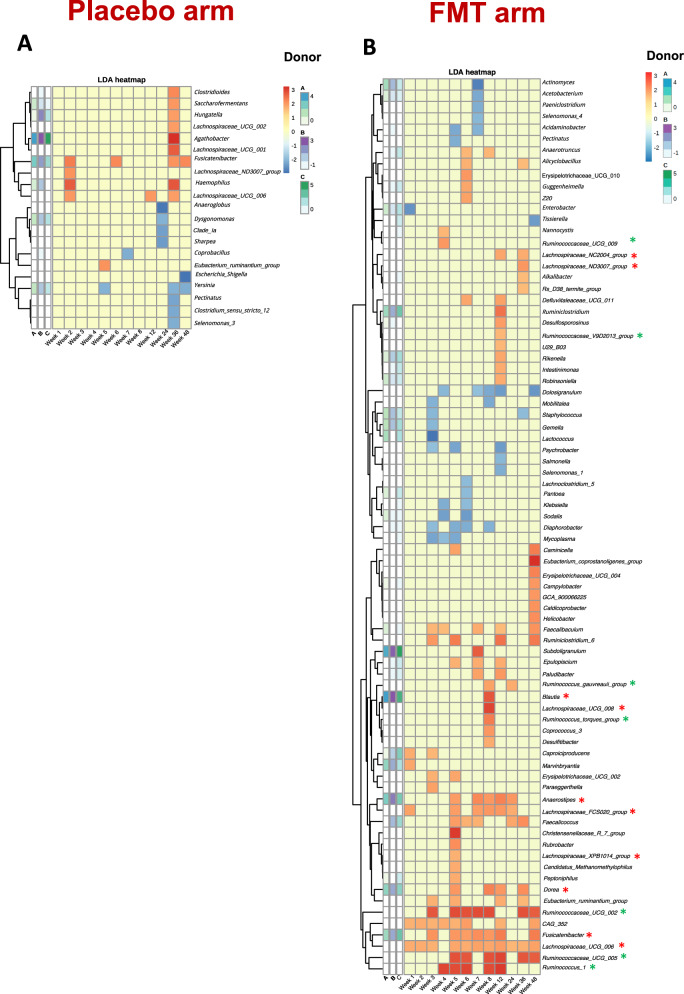
Fig. 5. Heatmap of LDA distances at the genus level from study participants to donors at each time point in the placebo (panel A) and FMT (panel B) groups.
For the LDA distances calculations in the participants allocated to receive a placebo, the values represented were calculated as the distances from each timepoint to the assigned donor. Each column represents one timepoint. The three columns represented on the left of the pale-yellow cells represent the distance from the assigned donor to the baseline visit, and inform on the relative abundance of the represented genus on study participants with respect to donors at baseline. Green asterisks identify the genus belonging to the Ruminococcaceae family. Red asterisks identify the genus belonging to the Lachnospiraceae family. Abbreviatures: FMT, fecal microbiota transplant. n = 369 biologically independent samples from 14 individuals in the FMT group, 15 individuals in the placebo group, and 3 donors.

