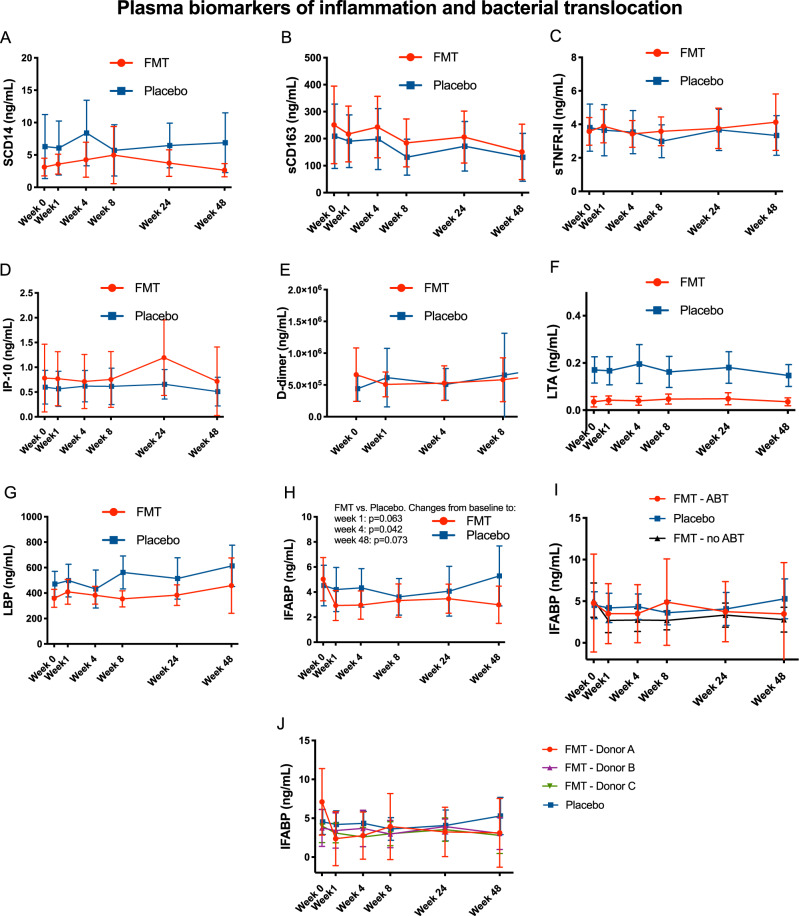
Fig. 6. Changes in plasma biomarkers of inflammation (A: sCD14, B: sCD164, C: sTNFR-II, D: IP-10, E: D-dimer) and bacterial translocation (F: LTA, G: LBP, H, I and J: IFABP).
Lines represent mean values in the FMT (red) and placebo (blue) group. Vertical bars represent the 95% confidence intervals. Two-sided P values estimated using mixed models not adjusted for multiple comparisons showed no significant differences between treatment arms, unless otherwise indicated, and remained unchanged after adjustment for nadir CD4 and time since HIV diagnosis. Abbreviatures: FMT, fecal microbiota transplant. n = 172 biologically independent samples from 14 individuals in the FMT group and 15 individuals in the placebo group. Experiments were run in triplicate.

