Figure 3.
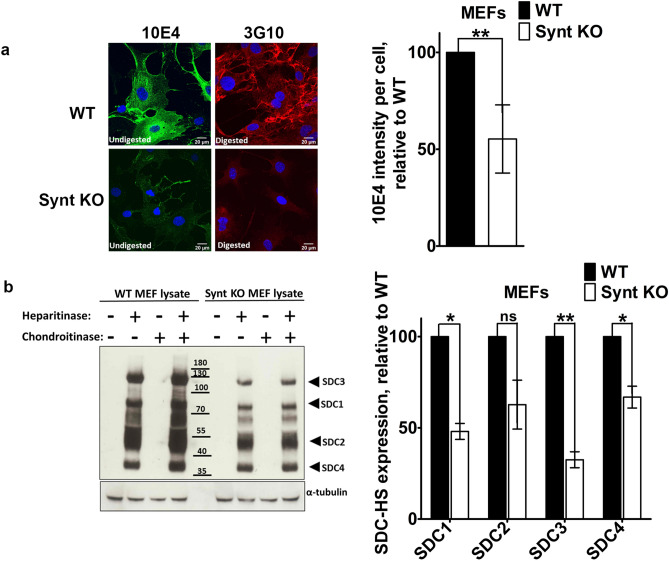
Loss of syntenin expression in primary MEFs leads to a decrease in HSPG expression. (a) Cell surface heparan sulfate abundance. Staining of total native HS, with mAb 10E4, in untreated cells (left panels), and of the residual delta-HS, with mAb 3G10, in cells treated with both heparitinase and chondroitinase ABC (right panels), in WT (top panels) and Synt-KO (bottom panels) MEFs. Compared to WT MEFs, Synt-KO MEFs show less intense fluorescence, for both 3G10 and 10E4, suggesting a reduction in both the number of HS chains and total mass of HS present at cell surfaces. Bar graphs on the right correspond to relative 10E4 fluorescence intensity per cell (taking WT cells as 100%). (b) Heparan sulfate proteoglycan abundance. (Left) Western blot of cell lysates, either left undigested (−) or digested (+) with heparitinase, chondroitinase ABC or a combination of both enzymes, and stained for delta-HS, using mAb 3G10, revealing the expression of HSPGs in WT and Synt-KO MEFs. Note that, compared to WT cells, Synt-KO MEFs show lesser amounts of delta-HS tagged PG core proteins (tentatively identified as the syndecans 1–4). (Right) Bar graphs represent the quantification of three independent experiments, taking band intensities in WT cells as 100%.

